Avigilon Cloud
Advanced System Health Dashboard
Designing scalable, actionable, multi-site **observability and governance** for enterprise security systems
Designing scalable, actionable, multi-site **observability and governance** for enterprise security systems
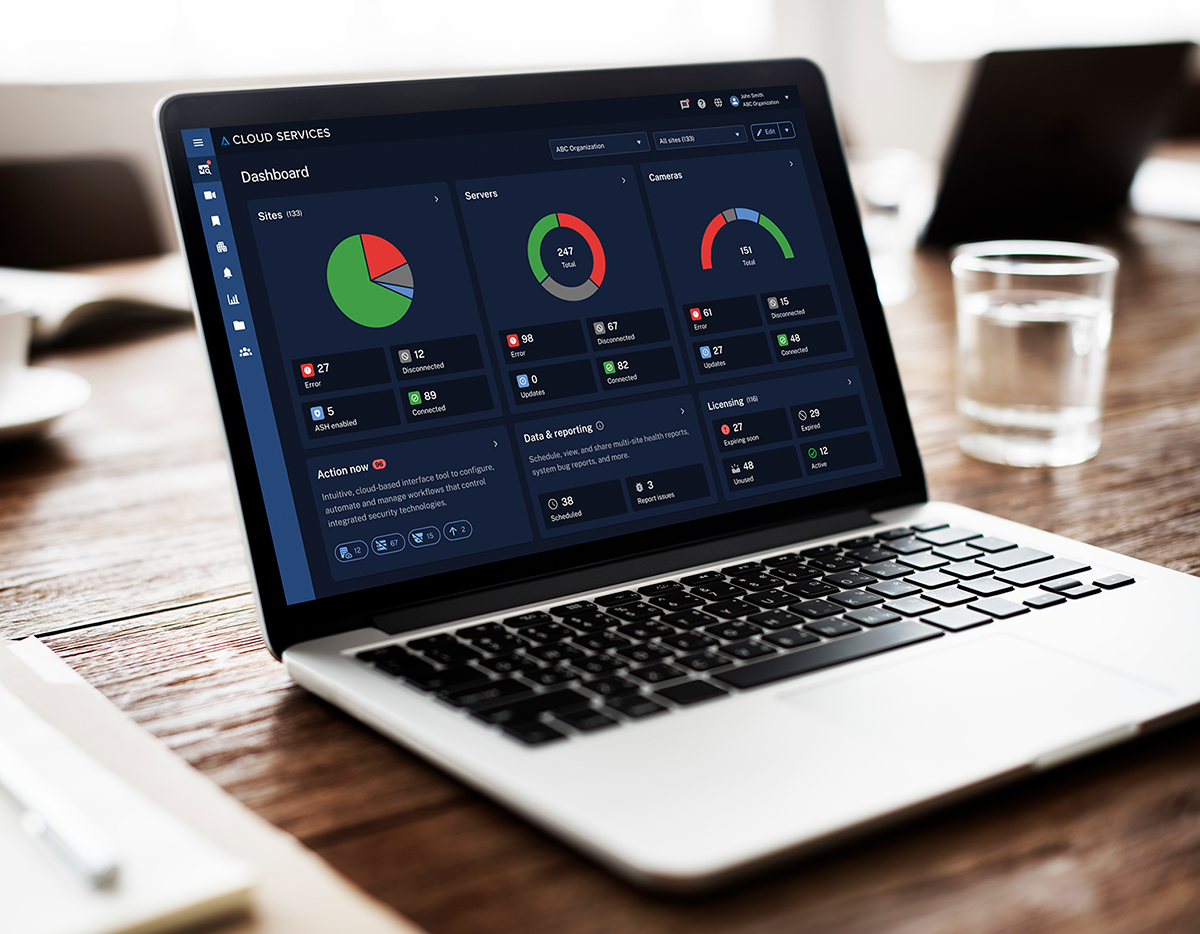
Avigilon, part of Motorola Solutions, is a leader in physical security software for enterprises with complex, multi-site deployments. The Cloud Advanced System Health dashboard was designed to deliver centralized, real-time visibility and control for **integrators, IT administrators, and security operators** managing thousands of devices across global locations.
As security systems scale to thousands of sites, servers, and cameras, managing health and uptime becomes unmanageable. Customers struggled with disconnected and misleading device statuses, lack of actionable insights, and repetitive troubleshooting, leading to **eroding trust and compliance risk (SOC 2 Availability).**
A centralized health dashboard providing a "single pane of glass" that summarizes health across all cloud-connected Avigilon sites, servers, and cameras, with actionable insights and immediate intervention capabilities for enterprise-scale deployments **to meet operational governance requirements.**
| Label | Count | % |
|---|
The dashboard launched successfully with live data visualizations for Sites, Servers, and Cameras, providing actionable and trustworthy **system health and audit evidence** at enterprise scale. It became the most compelling reason for customers to adopt cloud solutions in historically on-premises security environments.
Customers responded positively to the "Action Now" feature and at-a-glance health cards, with feedback requesting more granular maintenance states and future warning/error segmentation. The dashboard successfully rebuilt user trust in system status reporting through improved accuracy and actionable insights.
Major enterprise customers and retail chains validated that this solution addressed their core operational needs for centralized **system health monitoring and compliance checks.**
I conducted extensive interviews and card-sorting exercises with enterprise customers, partners, and internal subject matter experts to understand what "**system health and governance**" meant at scale. Key participants included stakeholders from 3 companies, product management, and SEs.

Configure and manage system integrations across enterprise deployments

Responsible for multi-site installations and ongoing maintenance

Oversee operational security for enterprise organizations

Handle day-to-day troubleshooting and repairs

Monitor security systems for retail and corporate environments
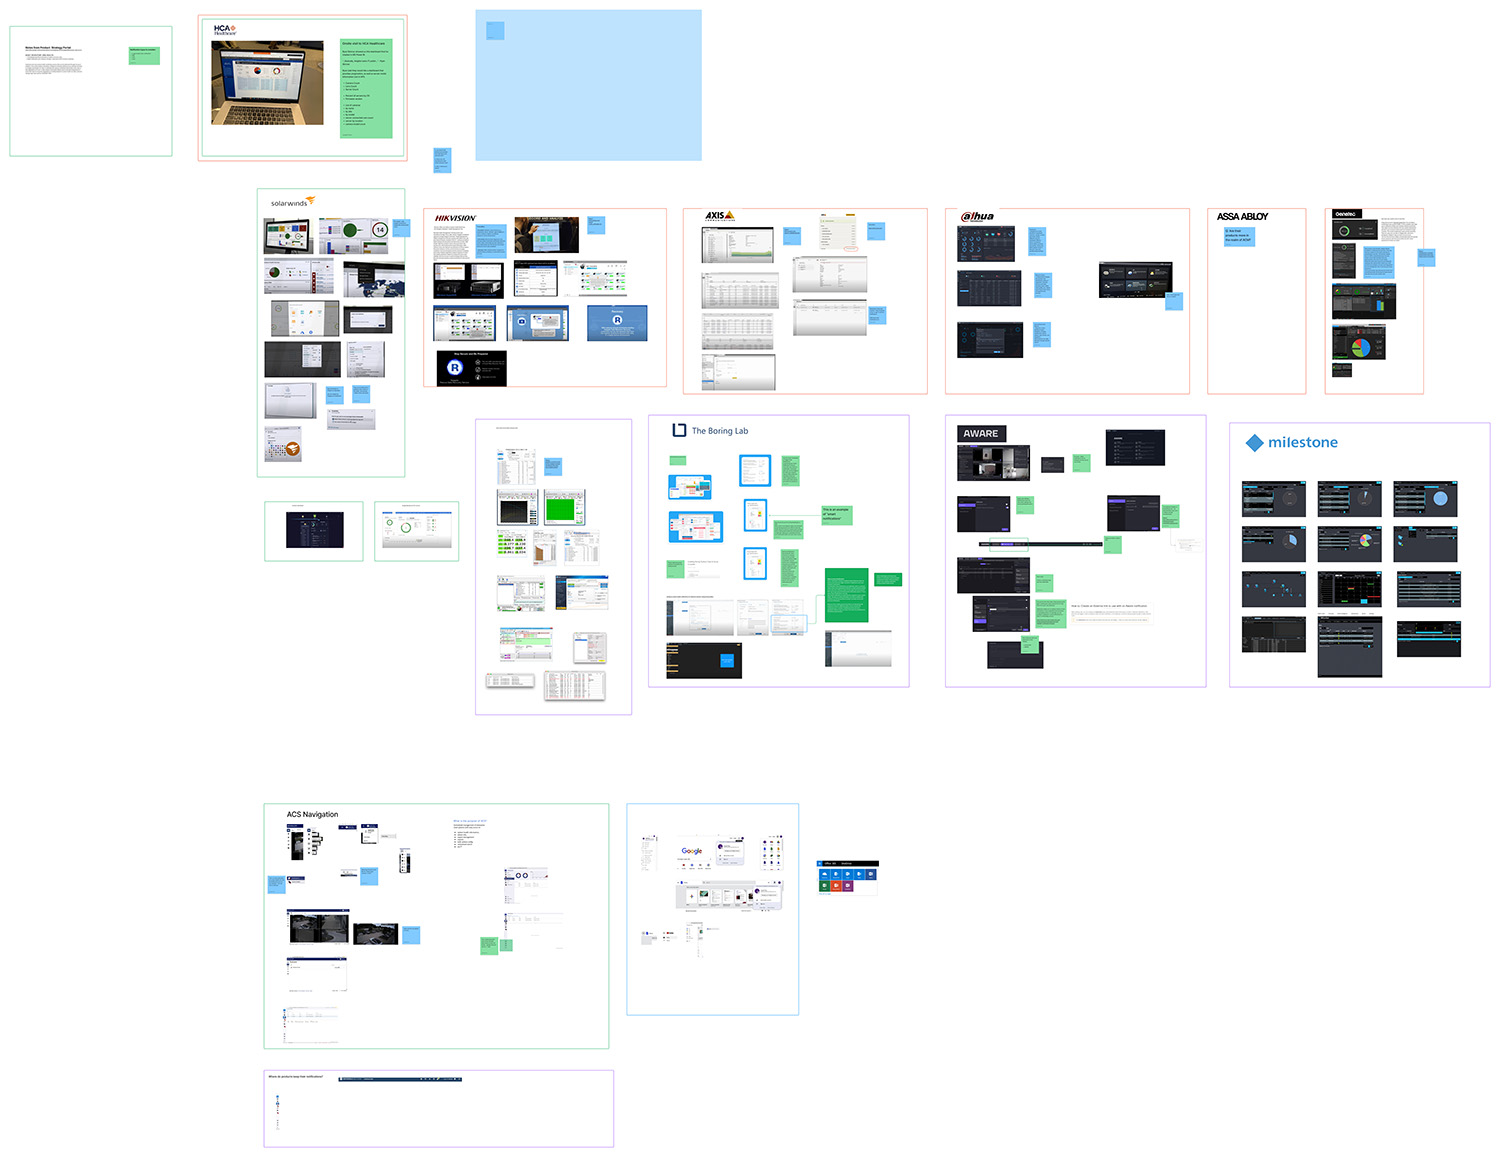
I benchmarked top competitors and on-premises solutions (Genetec, Milestone) to surface best practices and pain points around **status observability, risk indicators,** and dashboard visualizations. This analysis revealed common issues with information overload and lack of actionable insights.
| Product | Multi-Site | Actionable Insights | Root-Cause Clarity | Chart Types | Customizable | Components |
|---|---|---|---|---|---|---|
| SolarWinds | Strong | Medium | Medium | Line, bar, gauges, histograms | Yes | Proprietary + JS chart libs |
| Hikvision | Weak | Low | Low | Basic bar/pie | No | Legacy UI components |
| Axis | Weak | Low | Low | Tables, minimal charts | No | Legacy tables |
| Dahua | Weak | Low | Low | Dense dashboards, basic charts | No | Proprietary |
| ASSA ABLOY | None | Low | Low | Pie + basic charts | No | Proprietary |
| OneStop | Moderate | Medium | Low | Pie + simple metrics | Limited | Proprietary |
| The Boring Lab | Single-site | Medium | Medium | Line, bar, pie | Limited | Highcharts-style components |
| Aware | Moderate | Medium | Medium | Bar, timeline, pie | Limited | React-based custom charts |
| Milestone | Strong | Medium | Medium | Pie, line, scatter, heatmaps | Partial | Proprietary + legacy UI |
Research confirmed that large-scale, multi-site partners care about rolled-up, high-level health (sites, servers, cameras), while local admins want actionable site/server/camera breakdowns. The need for **role-based access and segmented privileges** was critical for enterprise adoption.
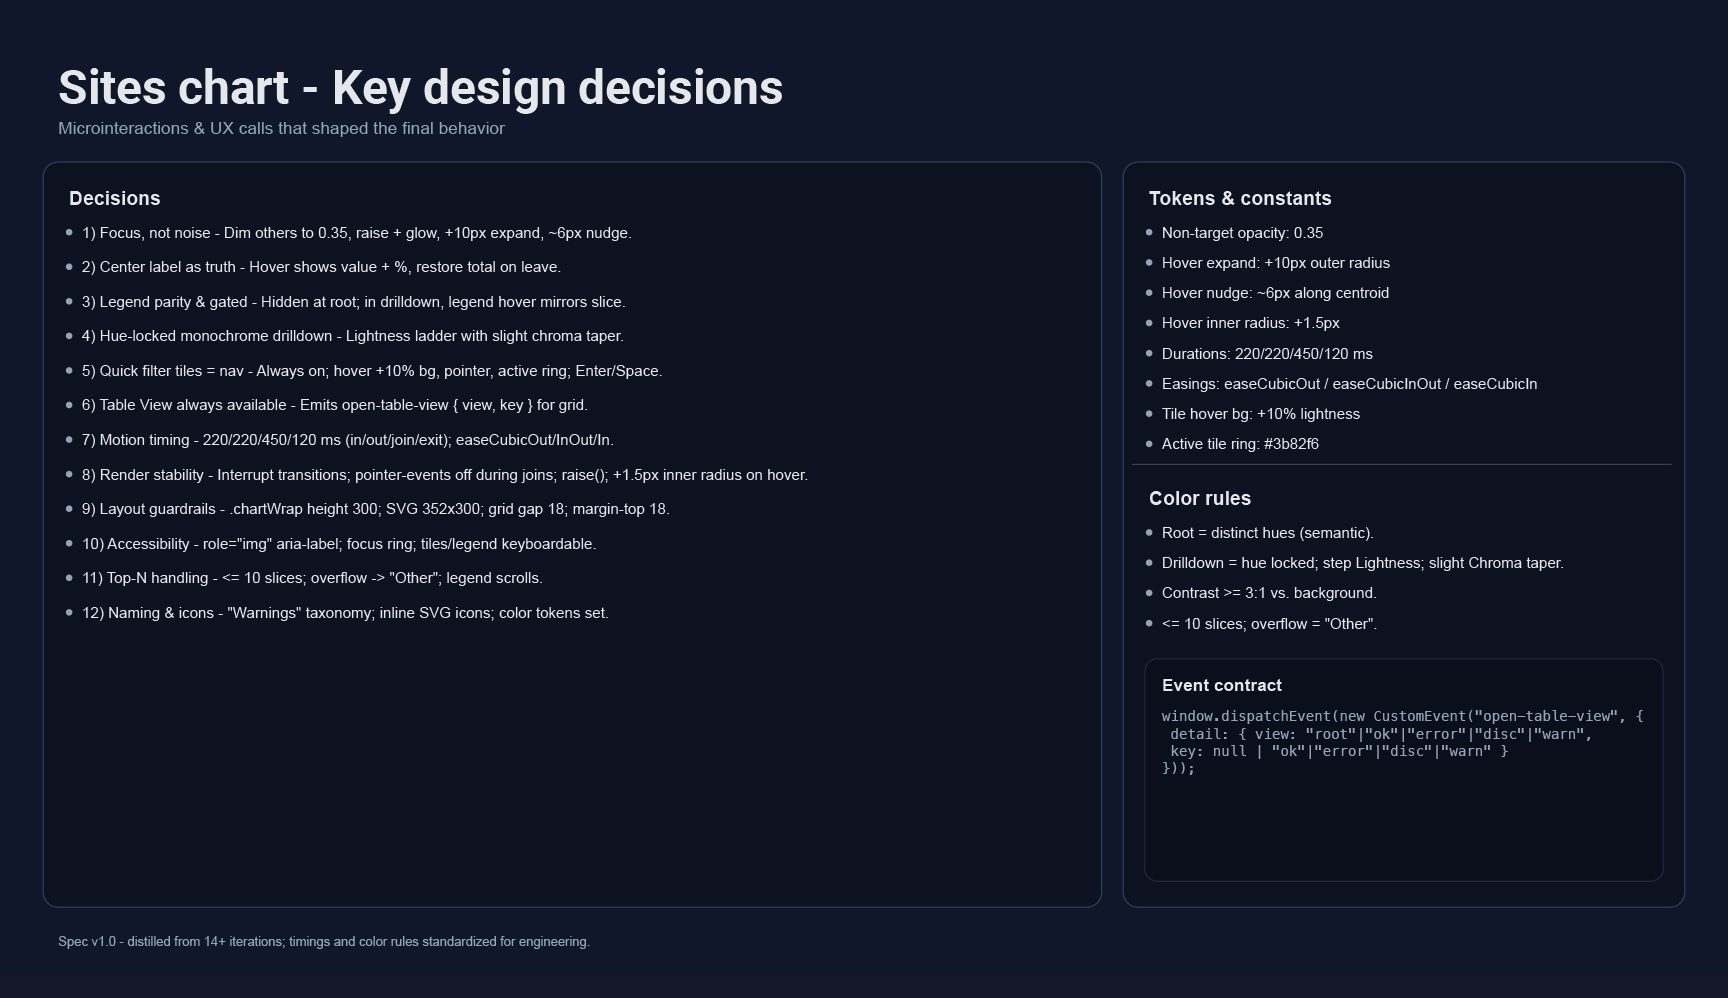
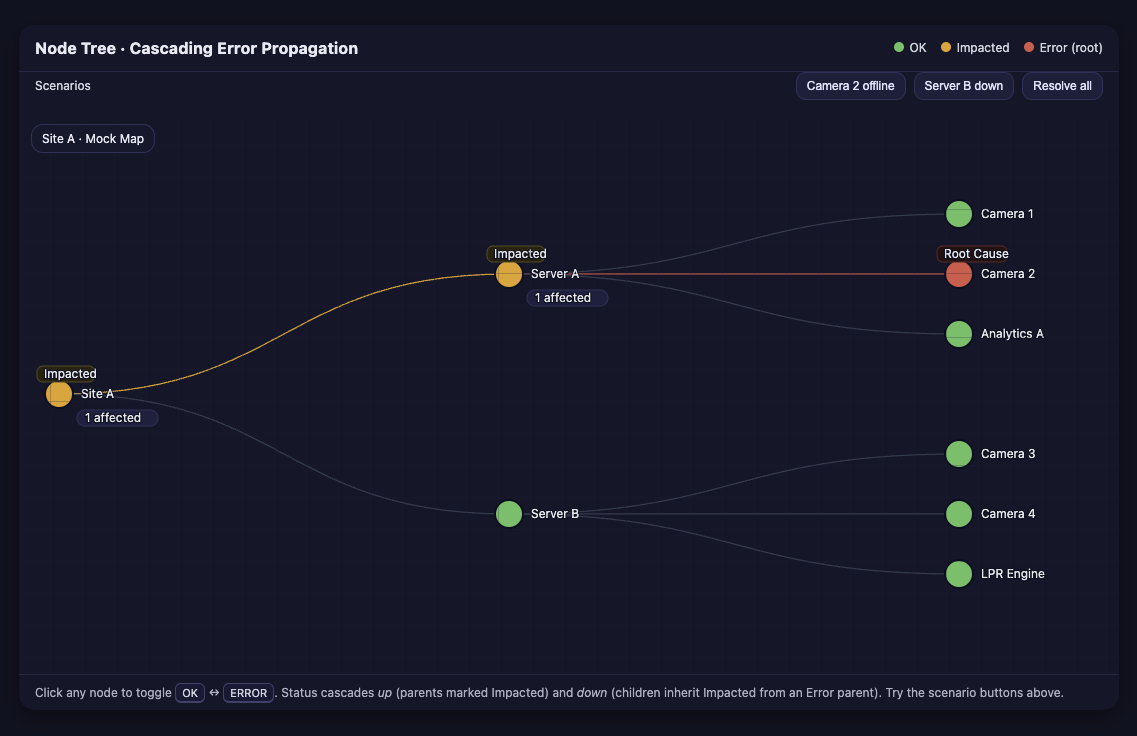
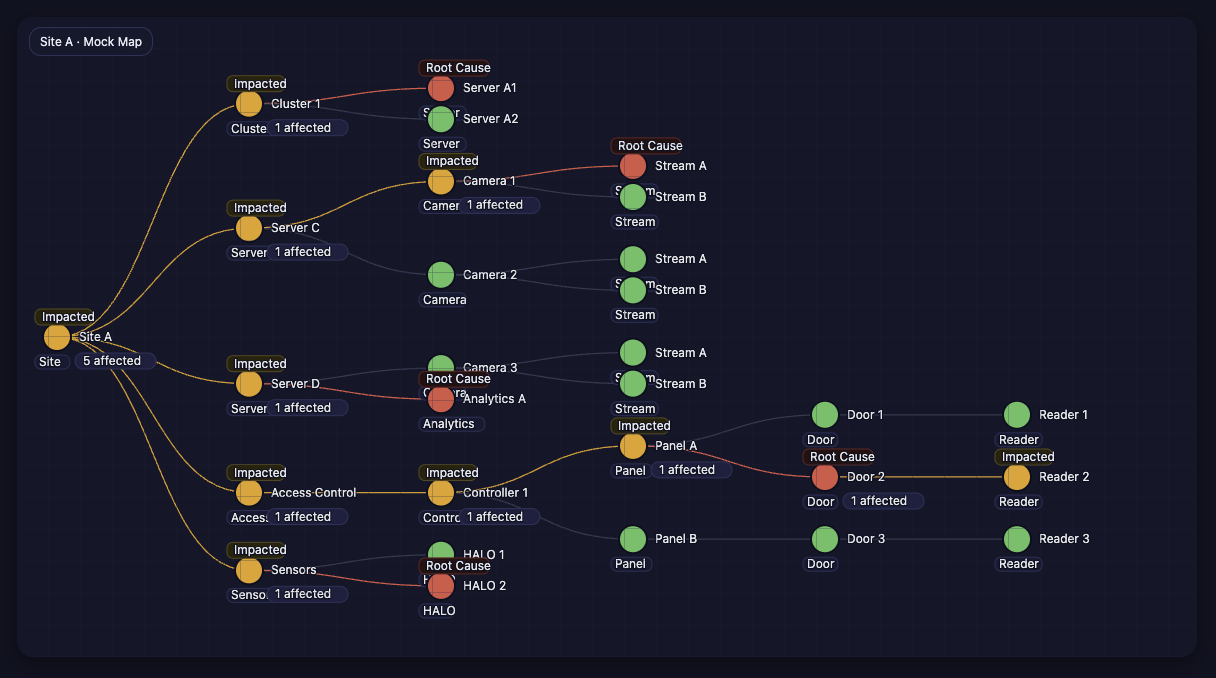
In complex cloud environments, a single device failure can ripple through dependent systems. We modeled bidirectional **health propagation** so a disconnected camera marks its parent server and site as degraded, while upstream server errors also flag dependent devices. This design clarified true root causes, reduced false positives, and helped operators prioritize action at scale.
I collaborated closely with Product Management Leadership, Engineering Leadership, and System Architects to address architectural issues and map all available device statuses. I evaluated the systems connected to Avigilon Cloud, analyzed every status, and met with engineering to decode the meaning behind error states.
To understand real-world impact, I interviewed customers, synthesized their feedback, and performed competitive analysis. My goal was to create a single pane of glass experience that was actionable, with status information cascading up the node tree. One core challenge was reconciling device status reliability across at least three different data sources — a backend problem that engineering needed to solve.
Information architecture issues led us to introduce a dealer view experience. We iterated through multiple prototypes, incorporating stakeholder feedback and making strategic compromises. Since Figma was not ideal for data visualization prototyping, I used the D3 library. With ChatGPT, I generated a JSON-based data factory to simulate the scale of our largest enterprise customer, then built proof-of-concept clickable prototypes in D3 to test and refine the design.
Conducted stakeholder interviews and card-sorting exercises with enterprise customers to understand system health requirements at scale.
Benchmarked competitors and on-premises solutions to identify best practices and pain points in status observability.
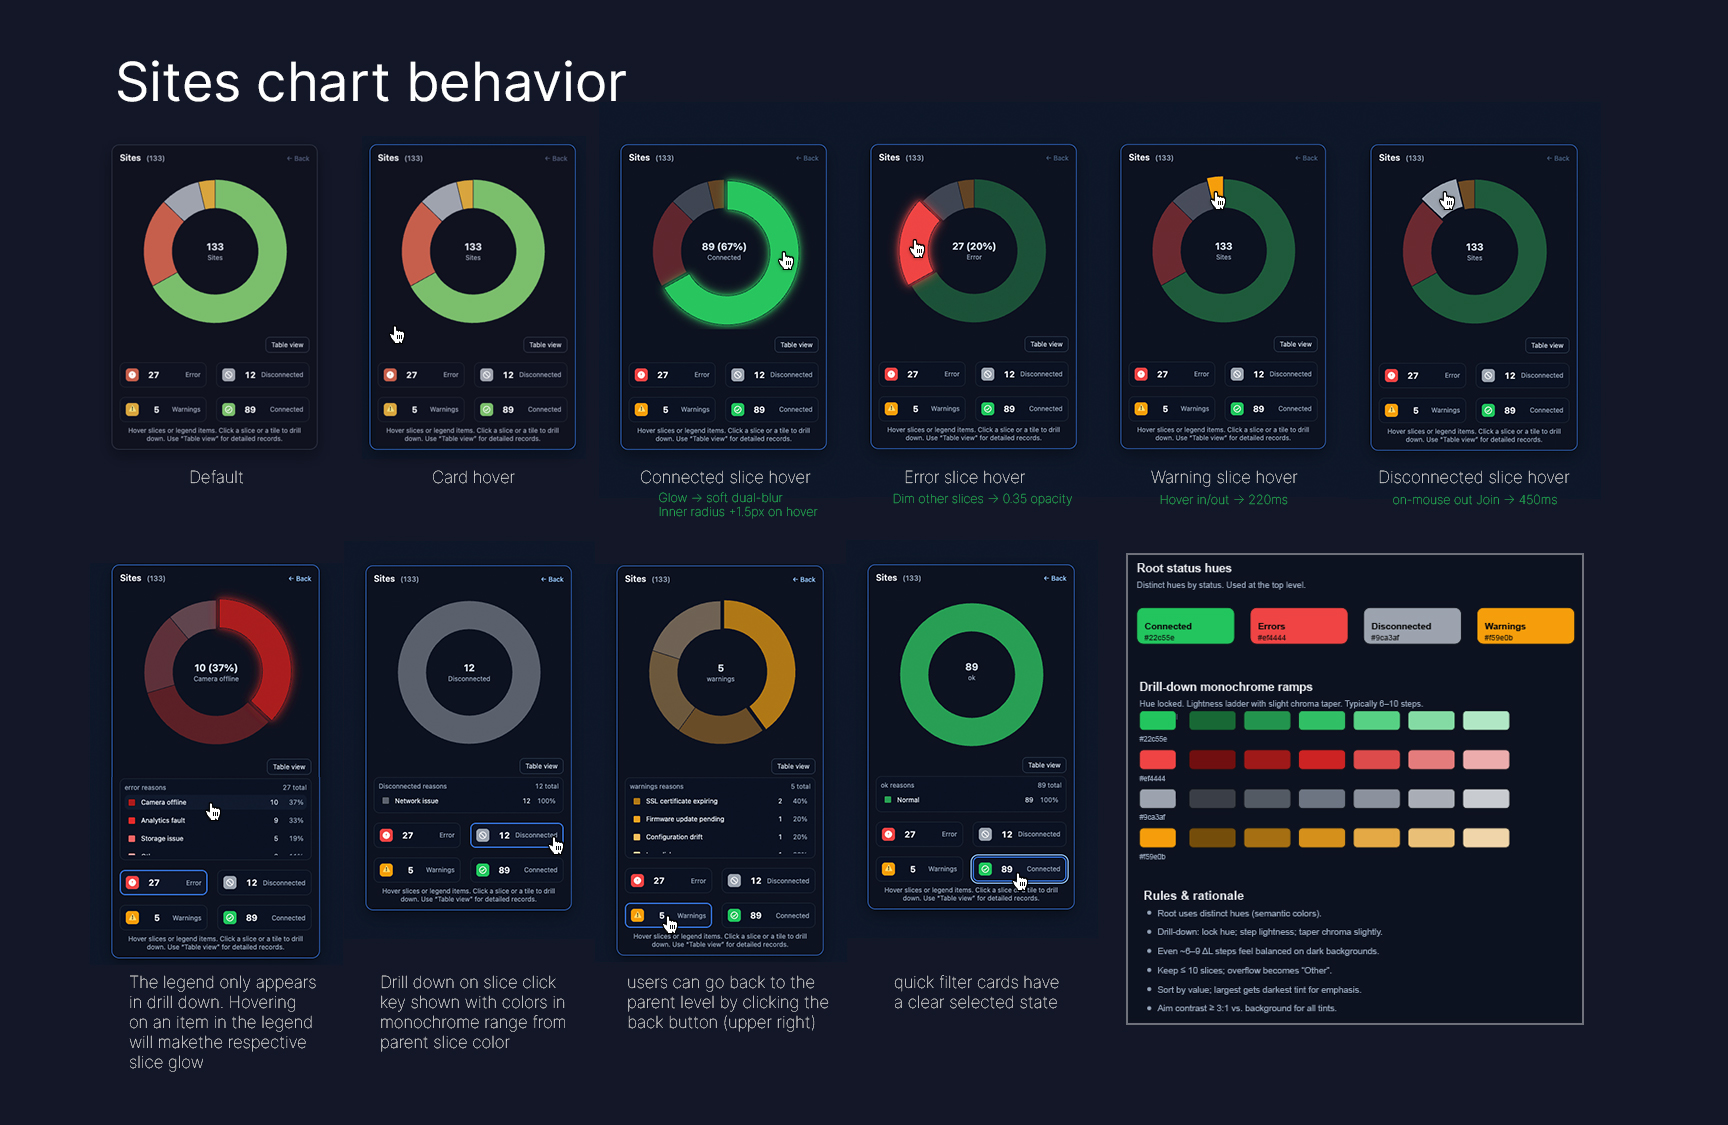
Explored D3 sunburst and data-dense charts. Figma is great but real components are better. I tested chart options and interactivity with D3 and JSON using real data sets.
Used data factory scripts to stress-test performance with large organizations (10,000+ devices).
I worked closely with engineering to resolve status "cascading" issues—understanding how a disconnected camera impacts server and site status. This collaboration was crucial for **rebuilding user trust through accurate status reporting** and prioritizing observability over raw data dumps.
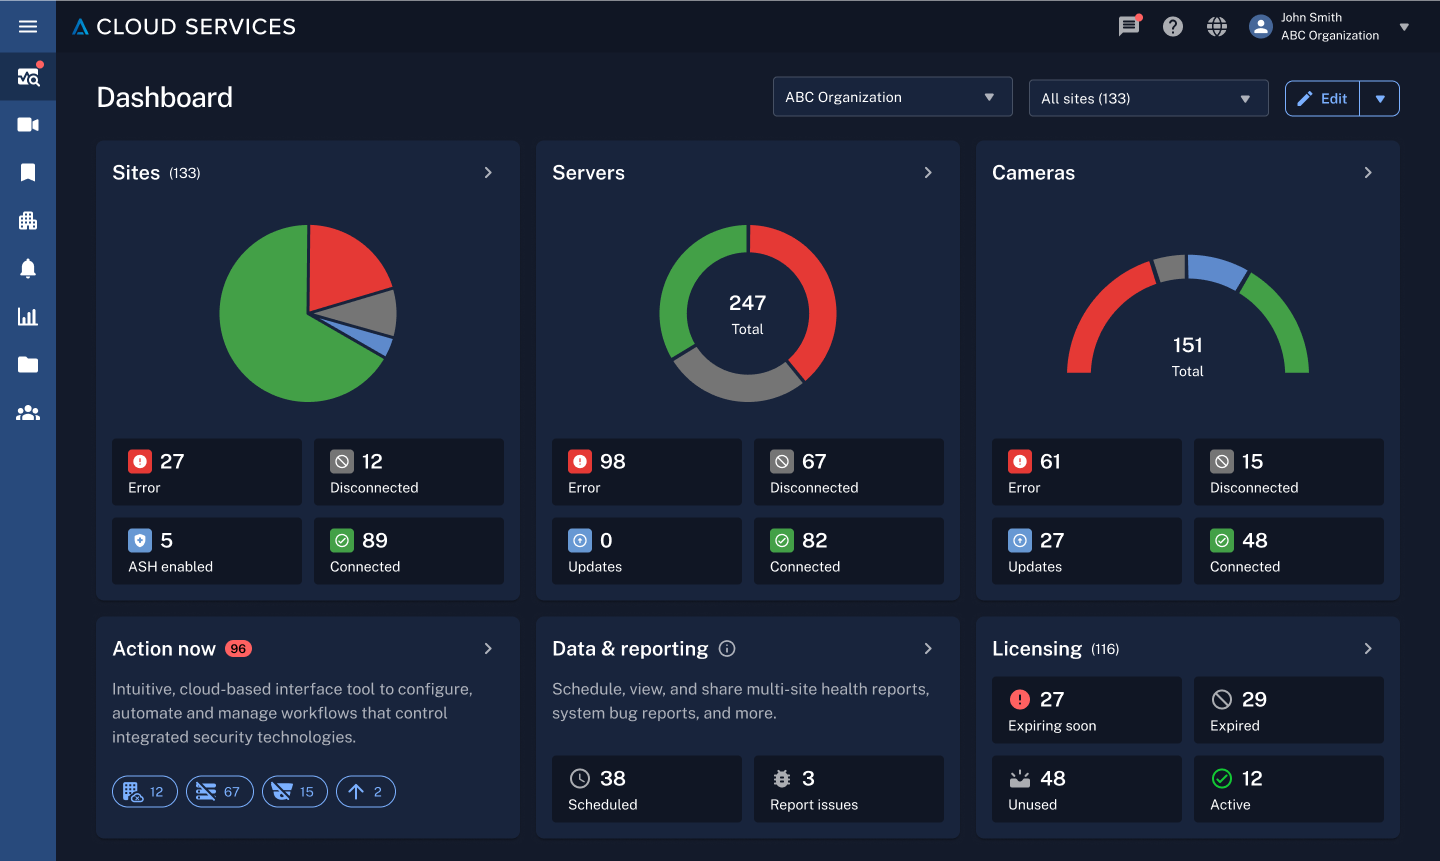
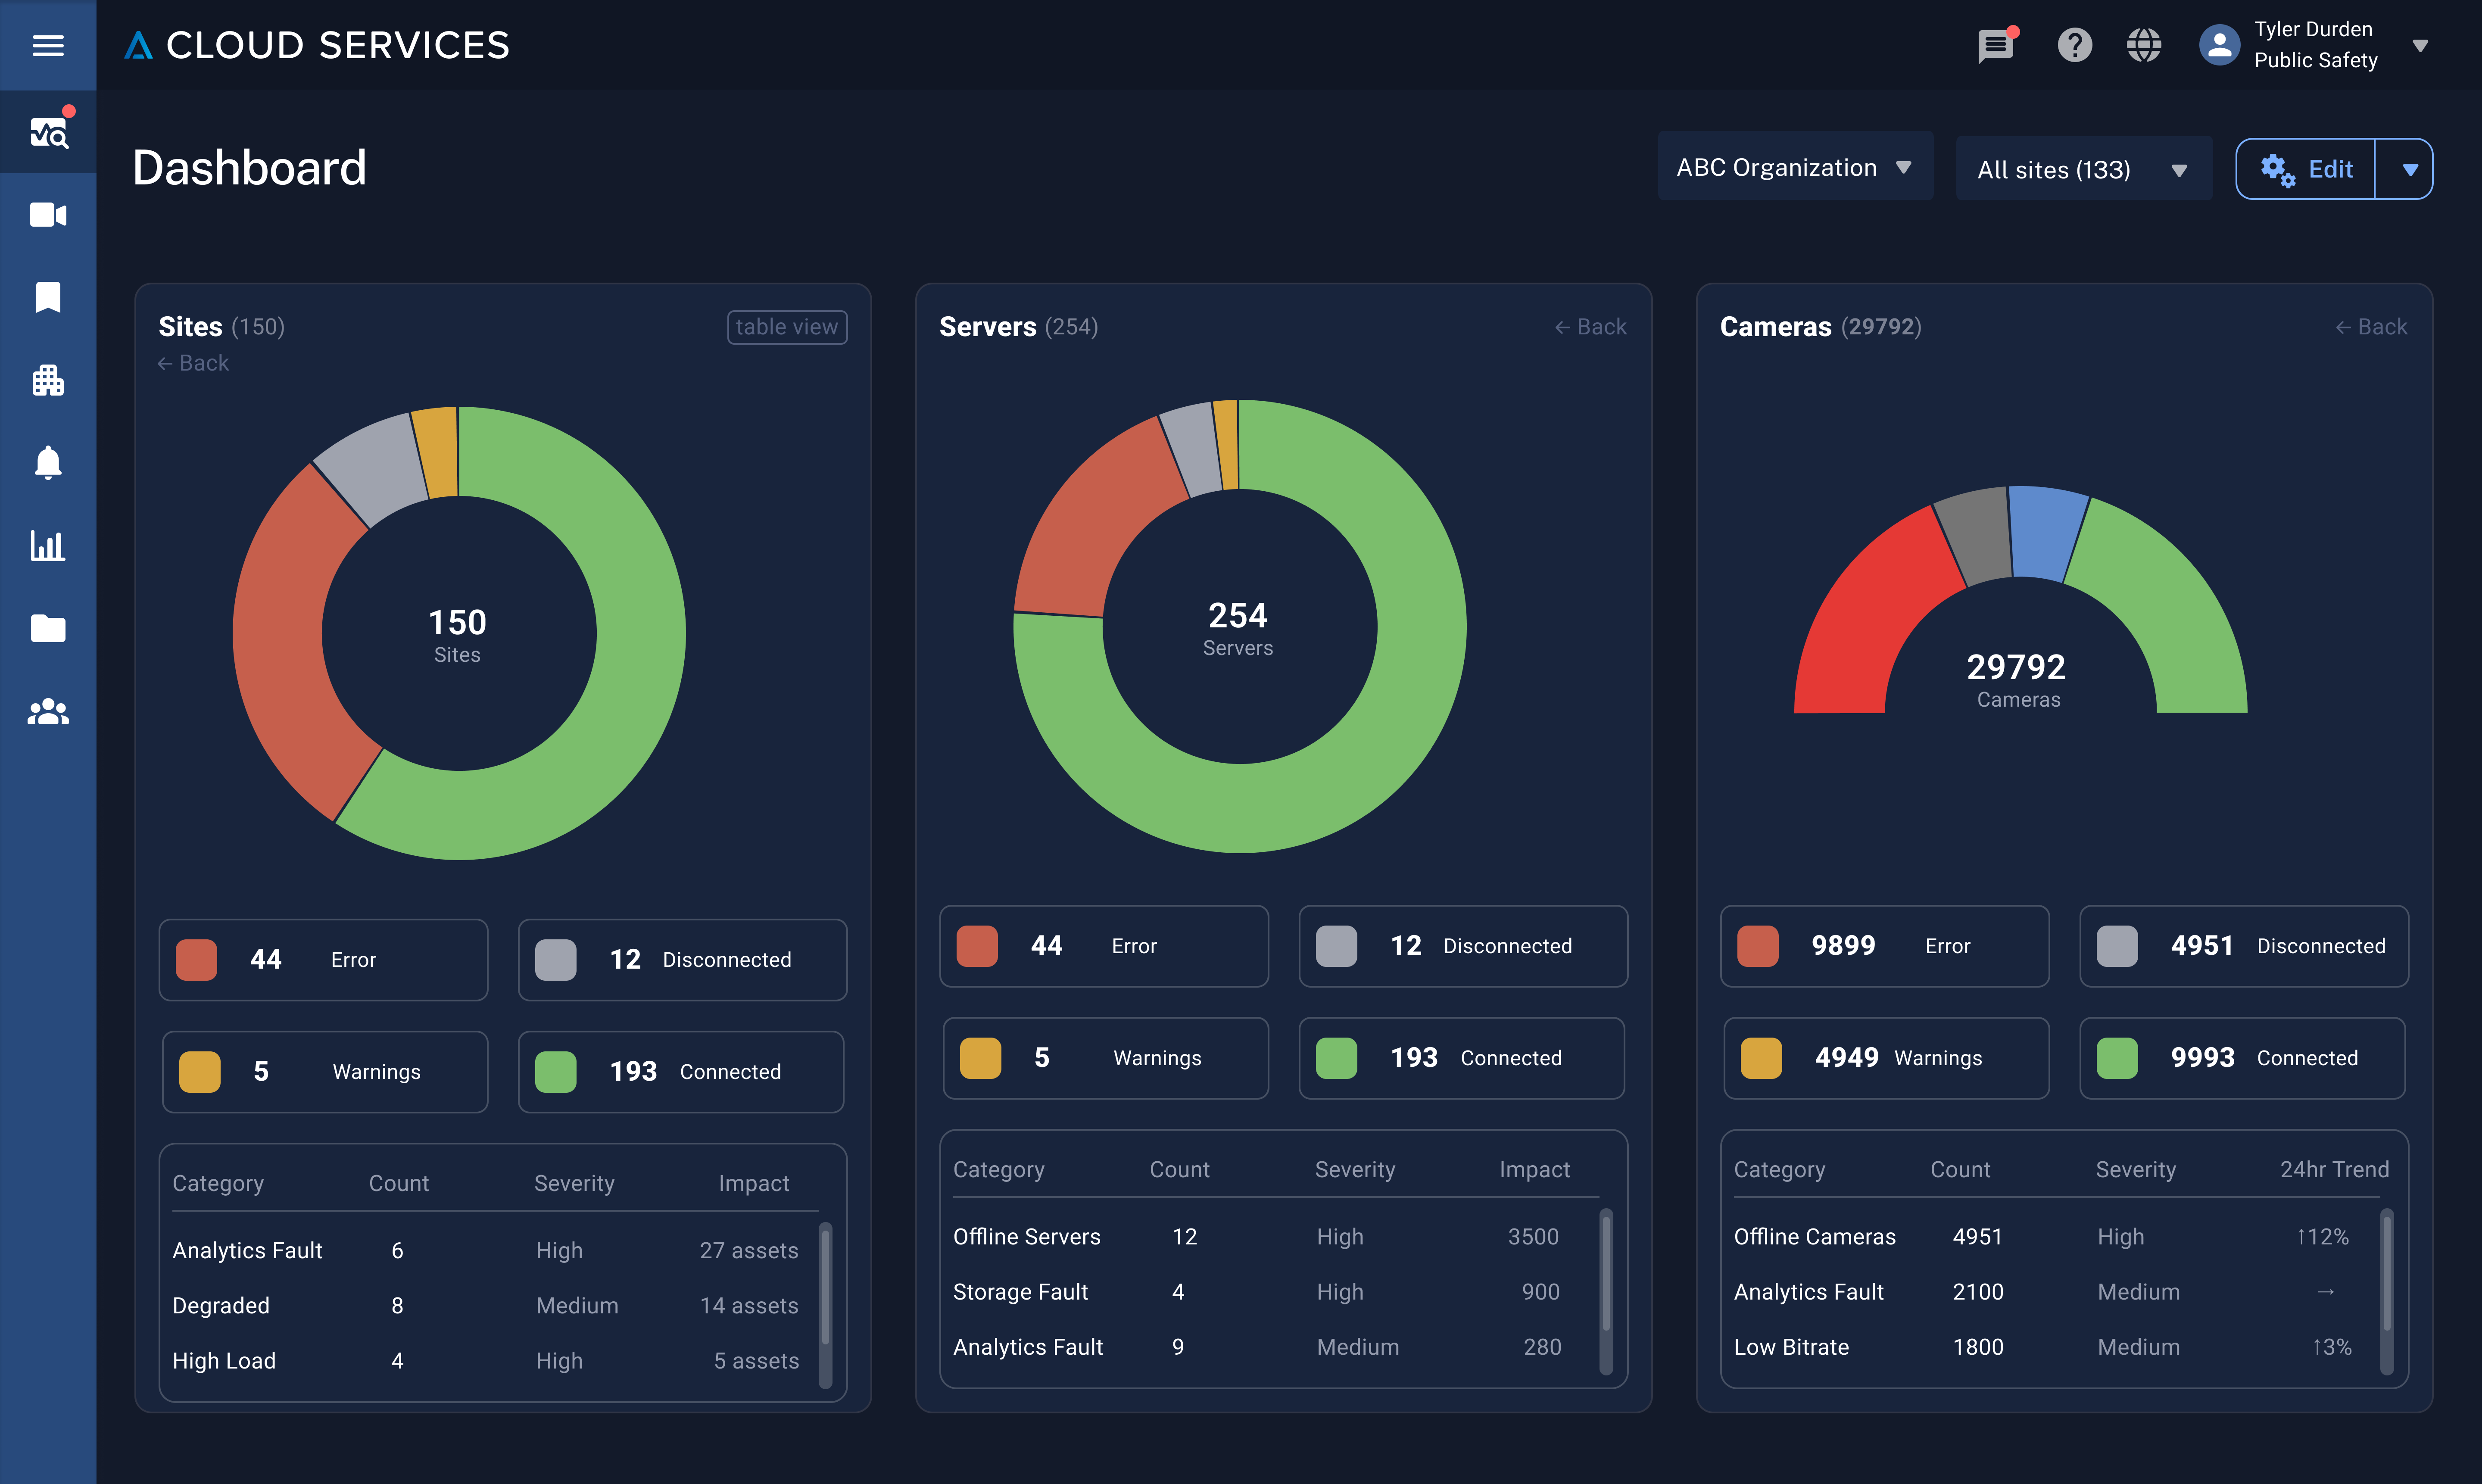
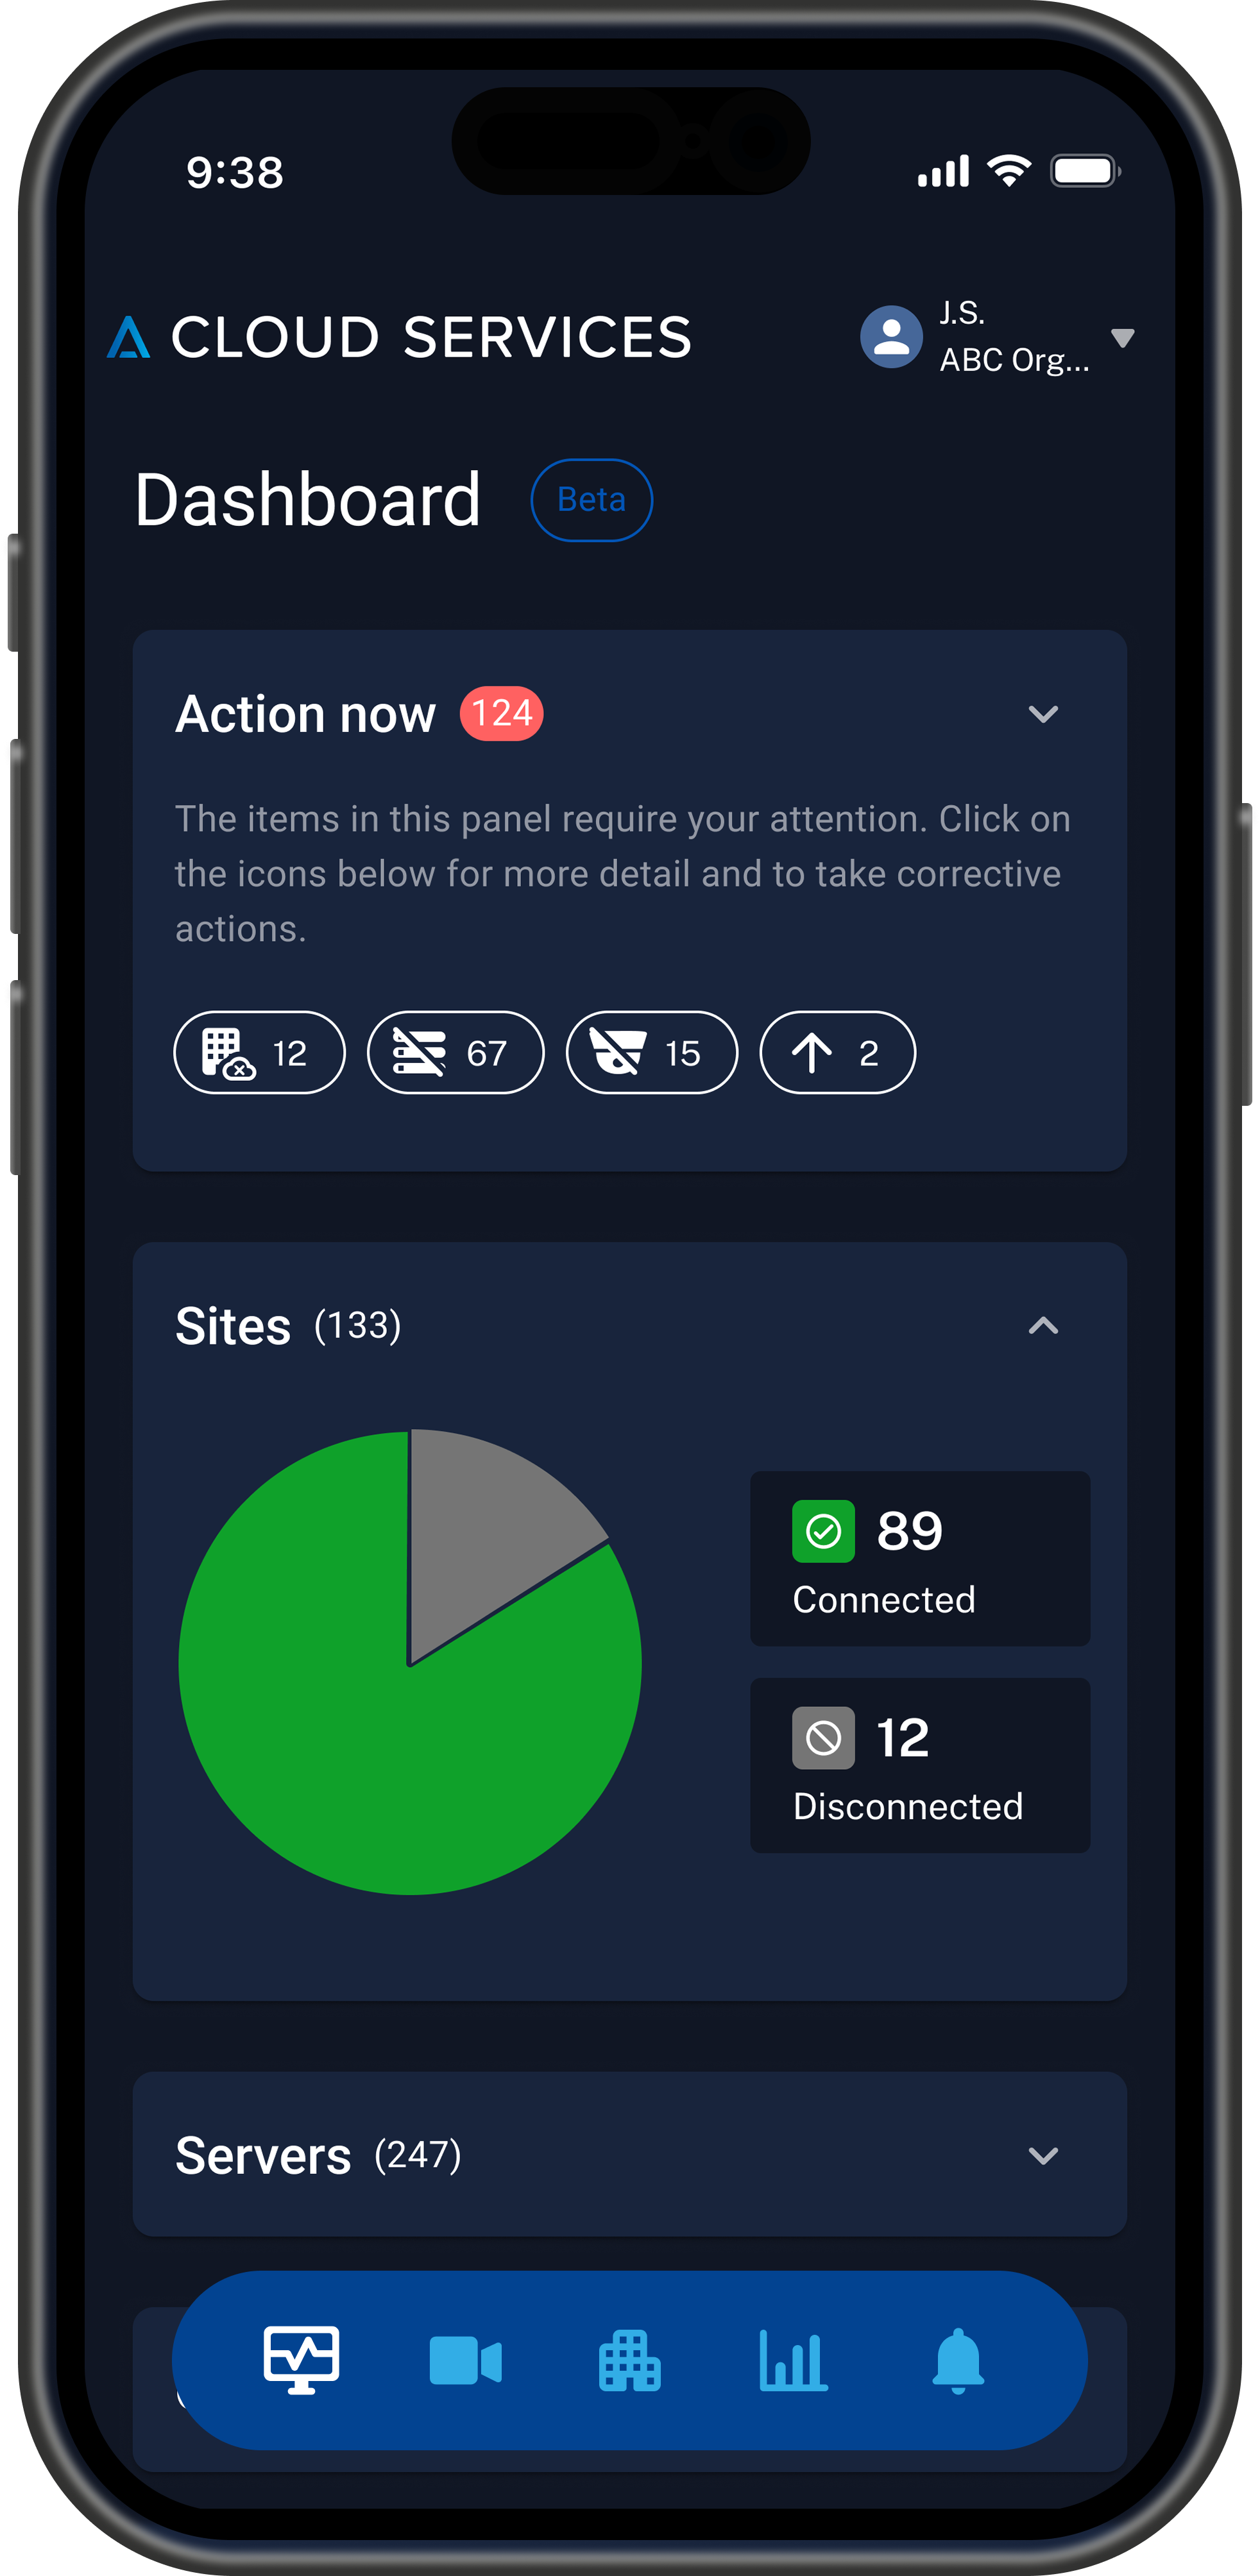
The dashboard centers around three high-level "at a glance" cards showing health by status: Sites, Servers, and Cameras, each displaying connected/disconnected/error states with future warning capabilities planned.
Dashboard (a/b test winner)
Dashboard (evolved design)
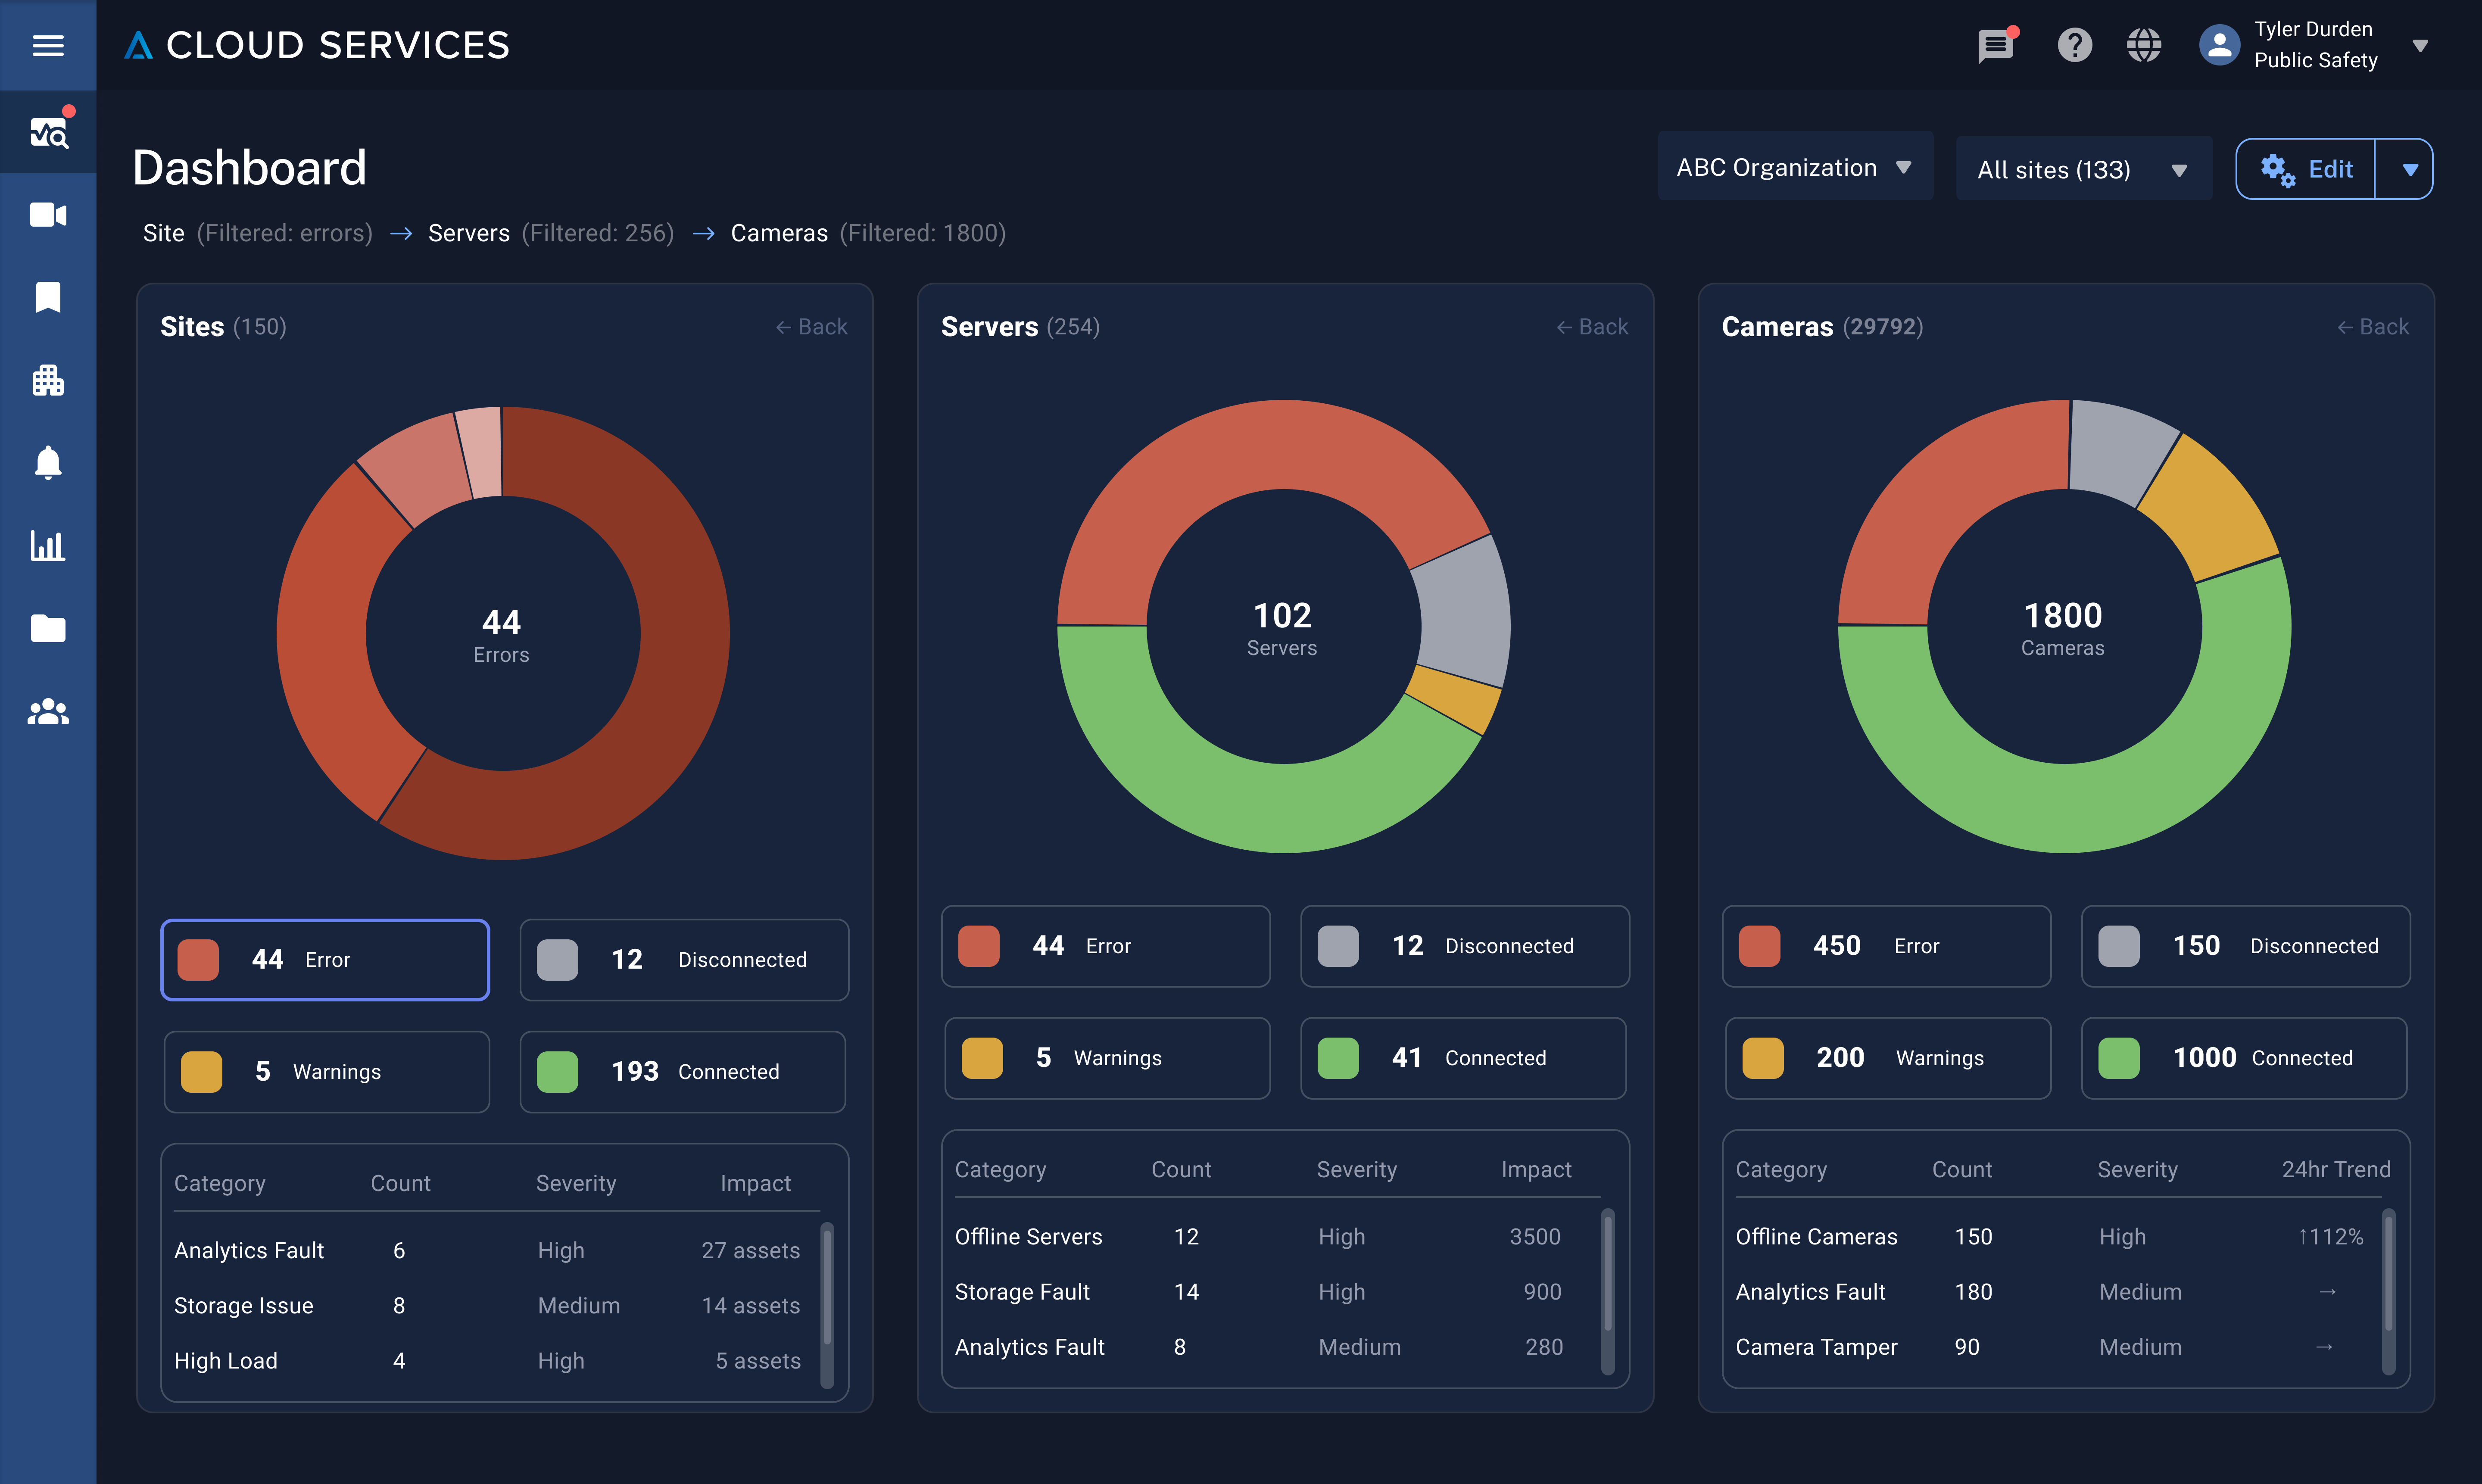
Dashboard (Site error drill down w/ breadcrumbs)
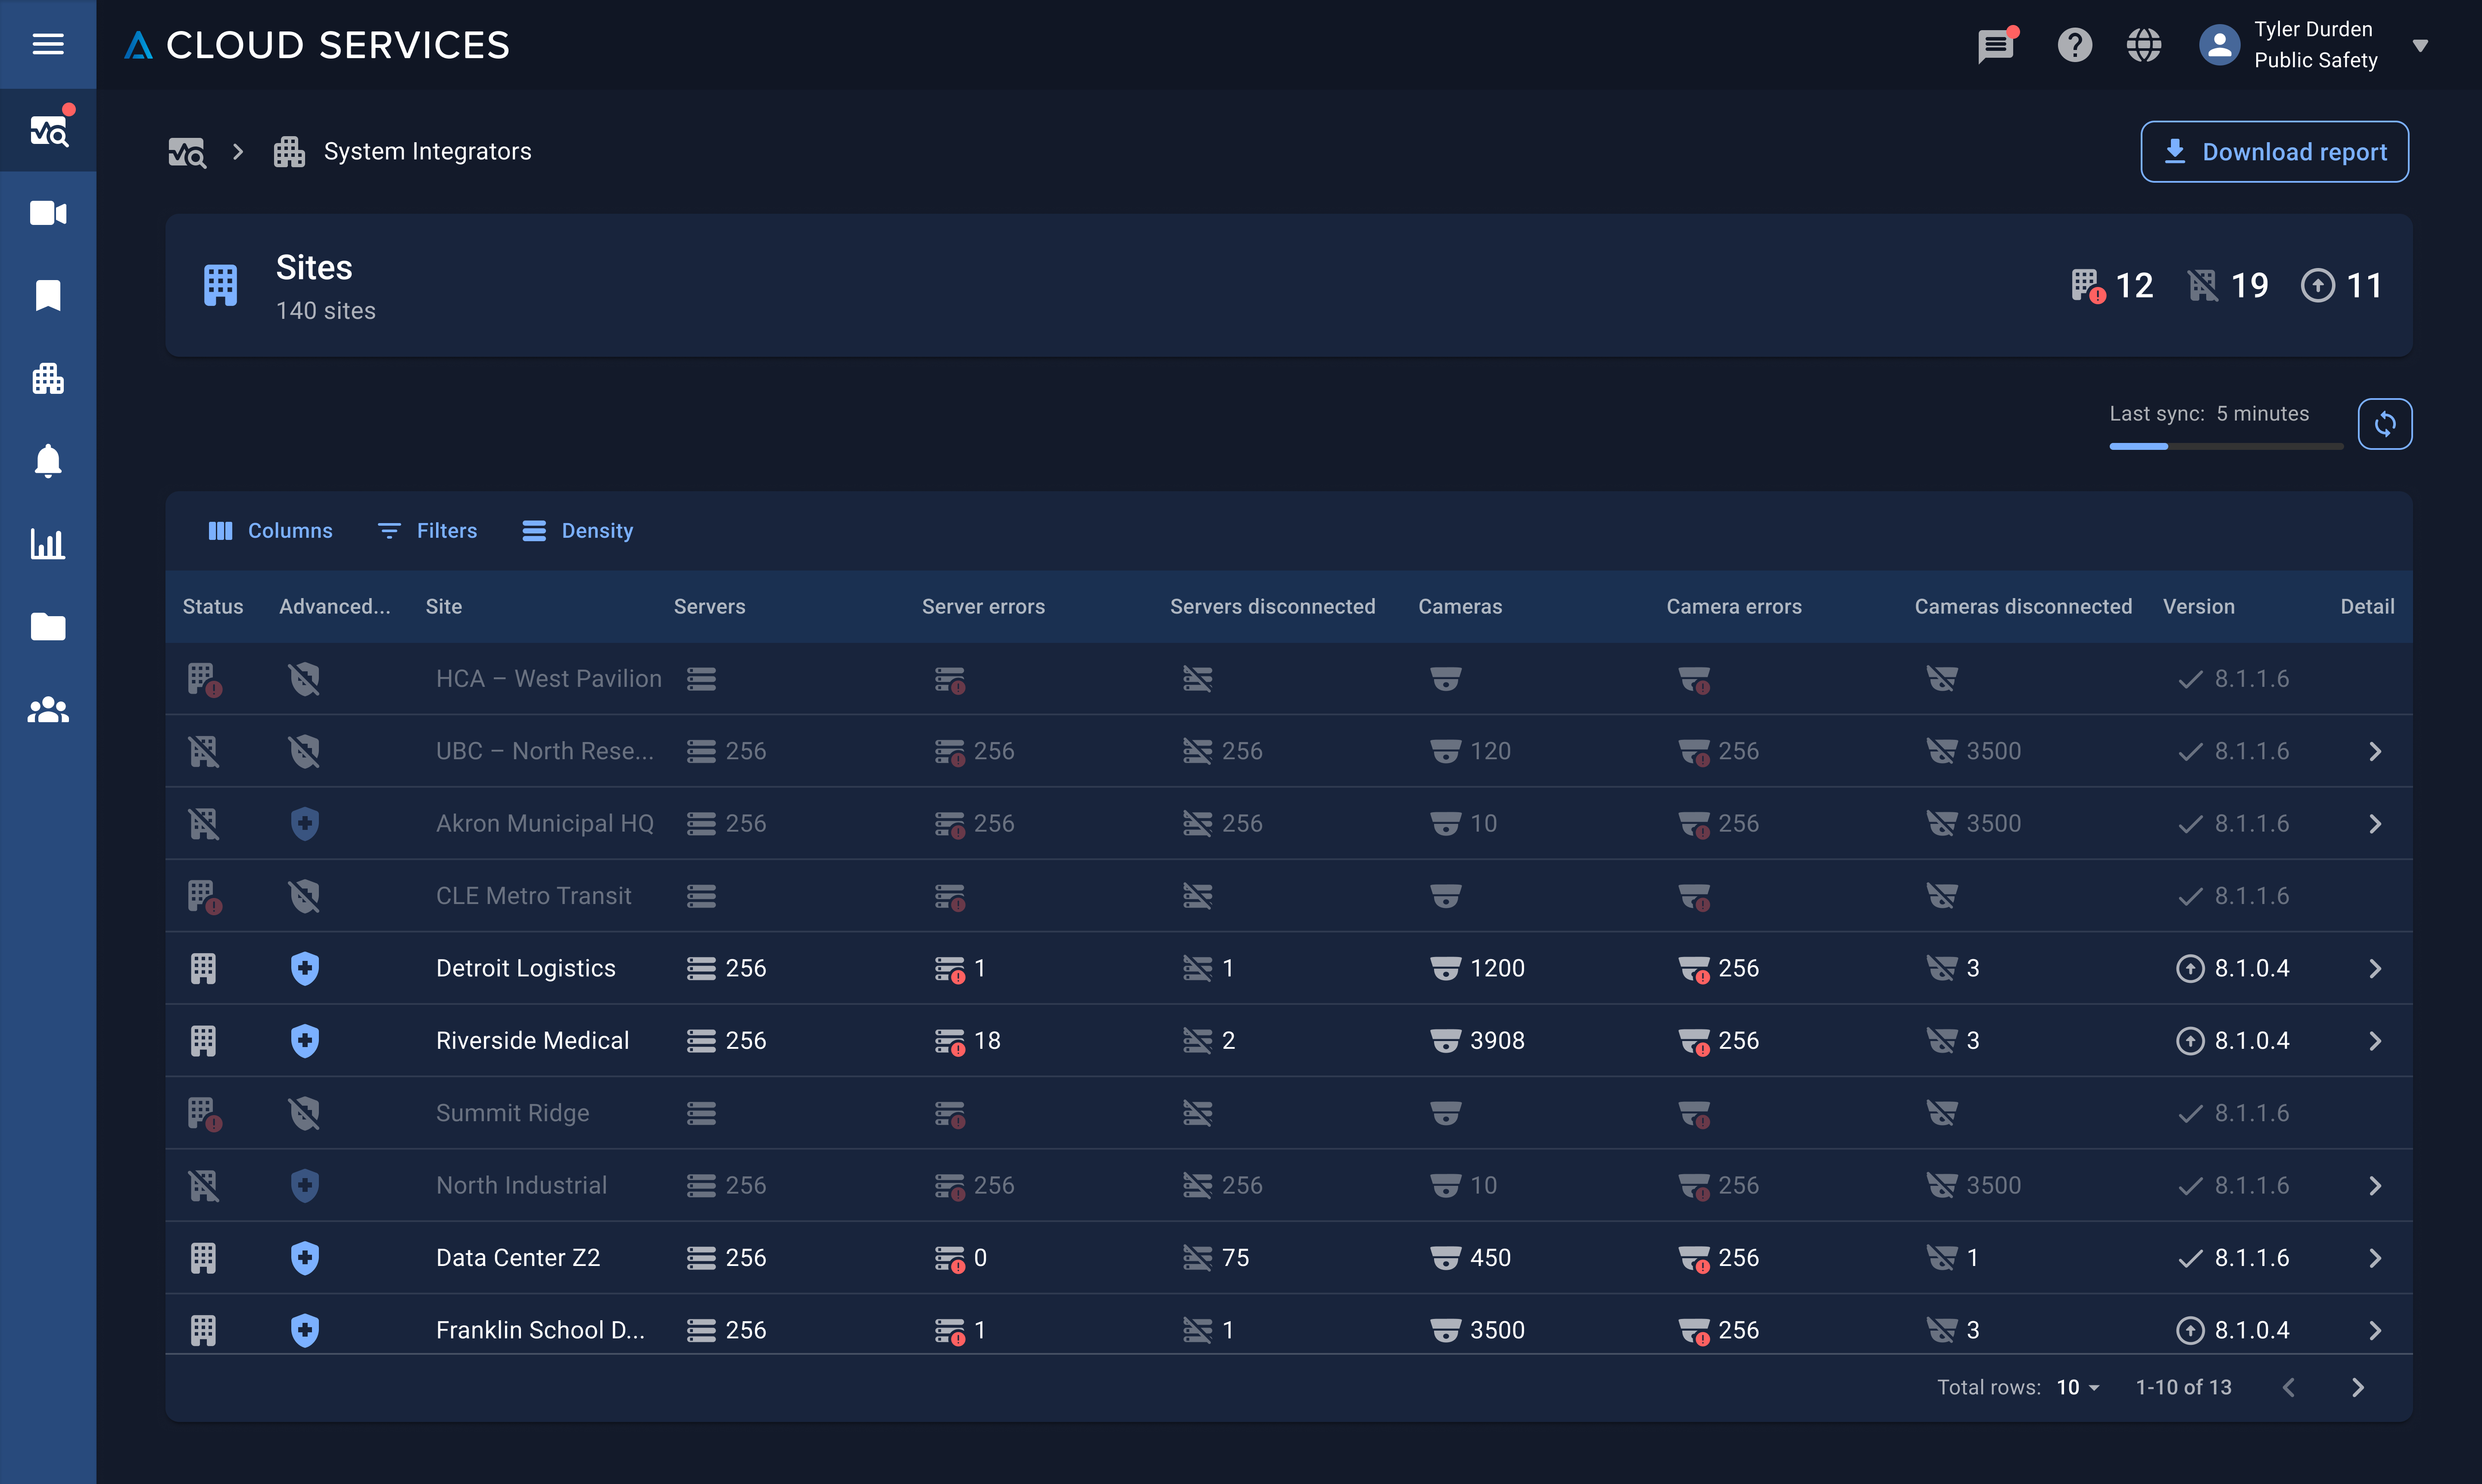
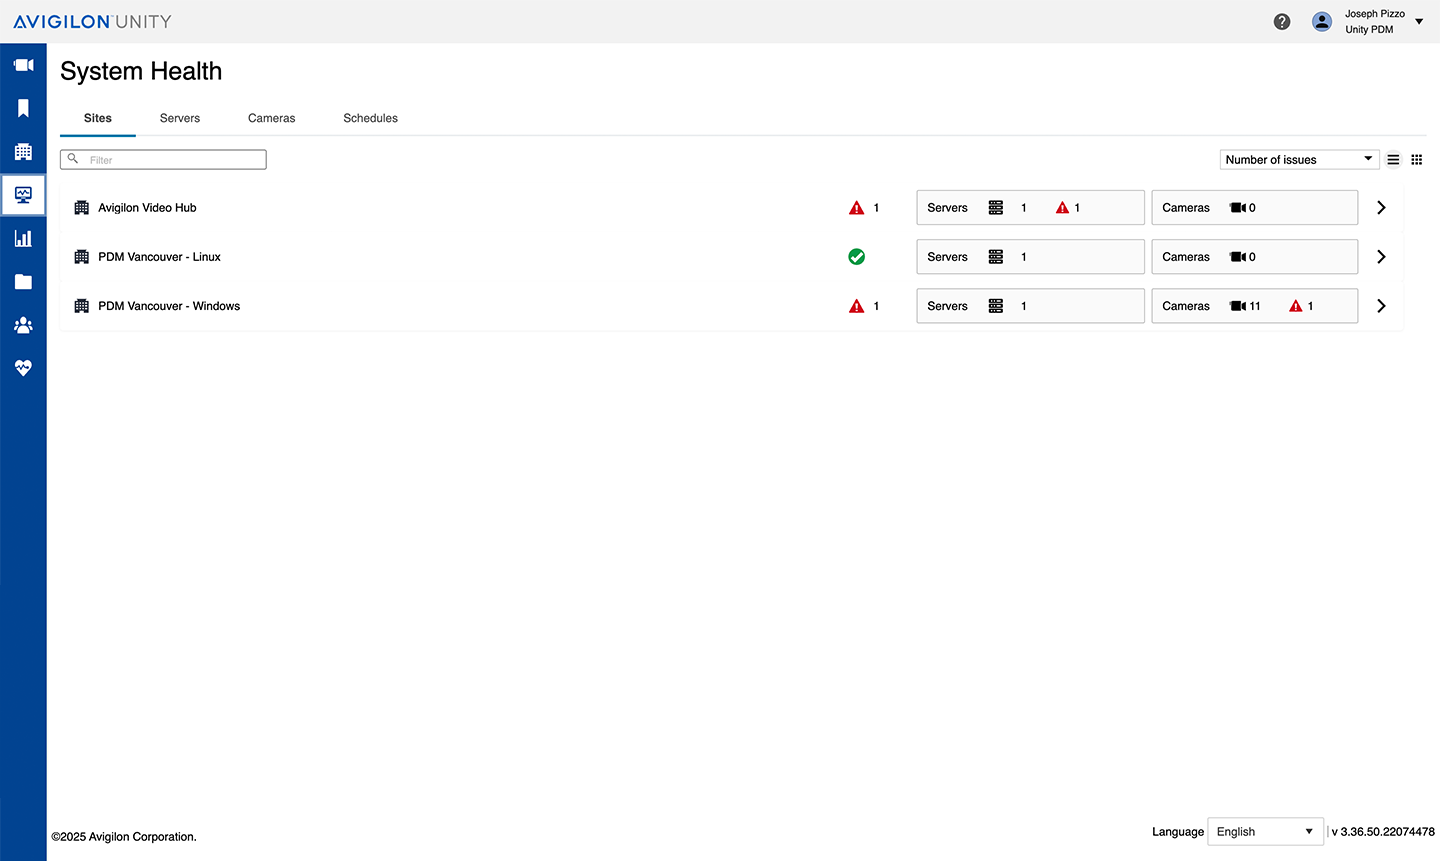
Sites list
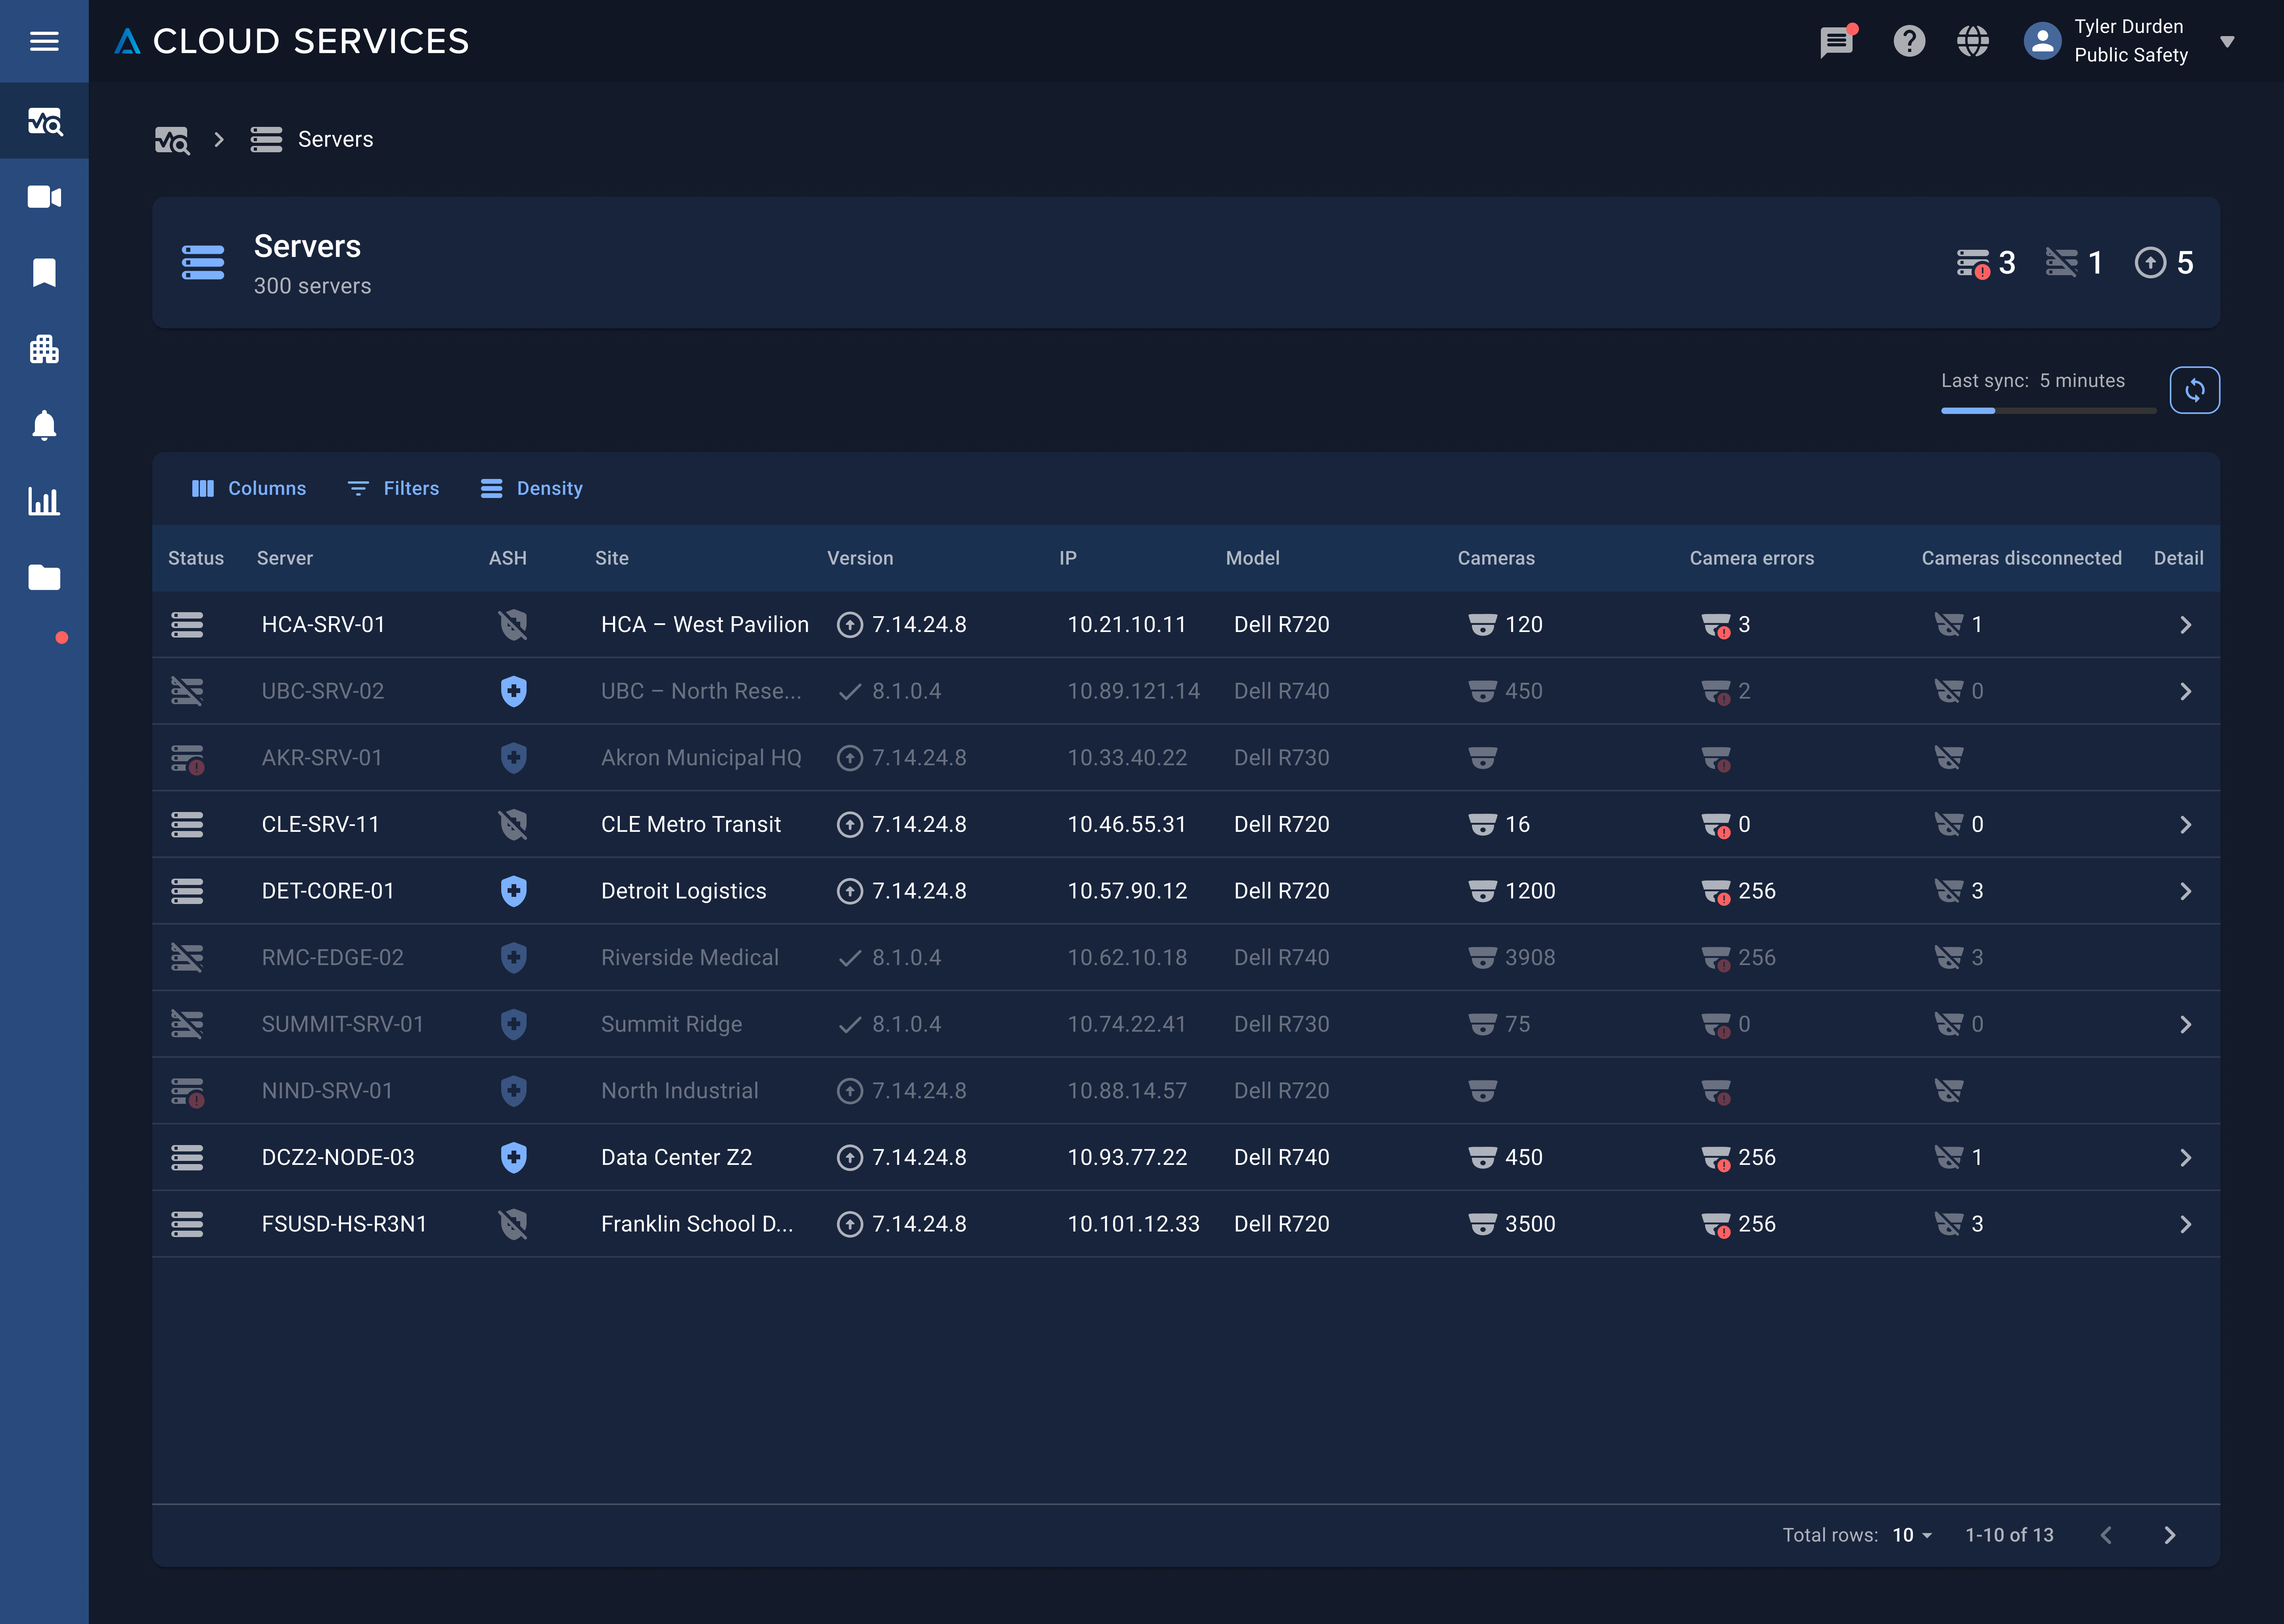
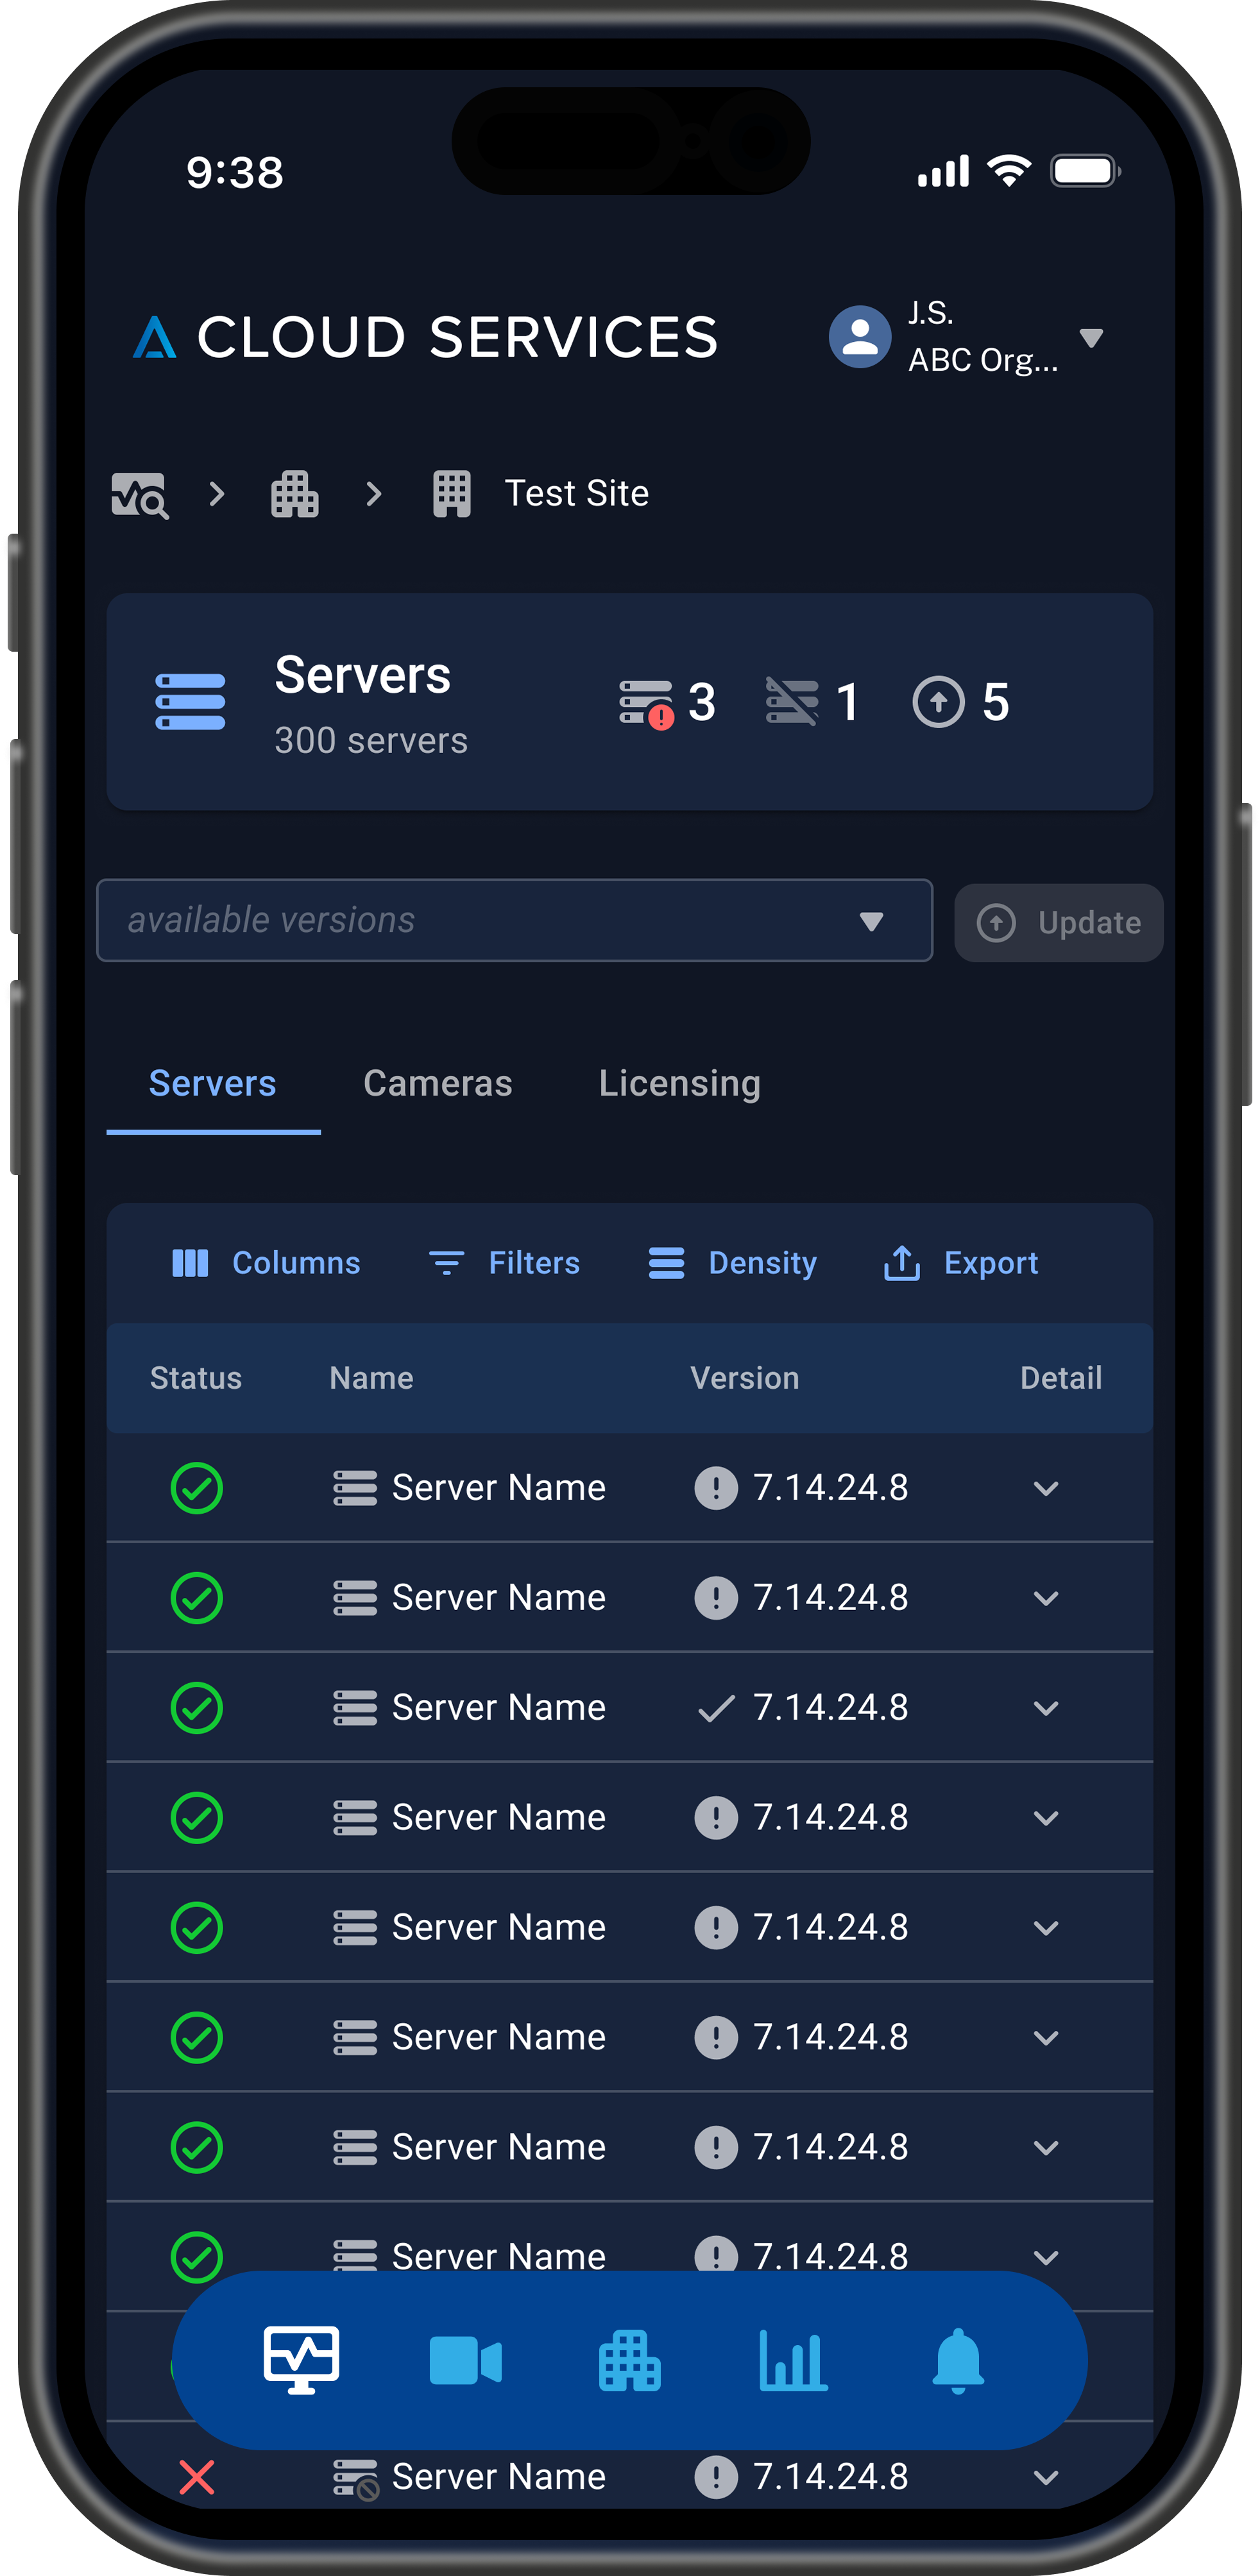
Server list
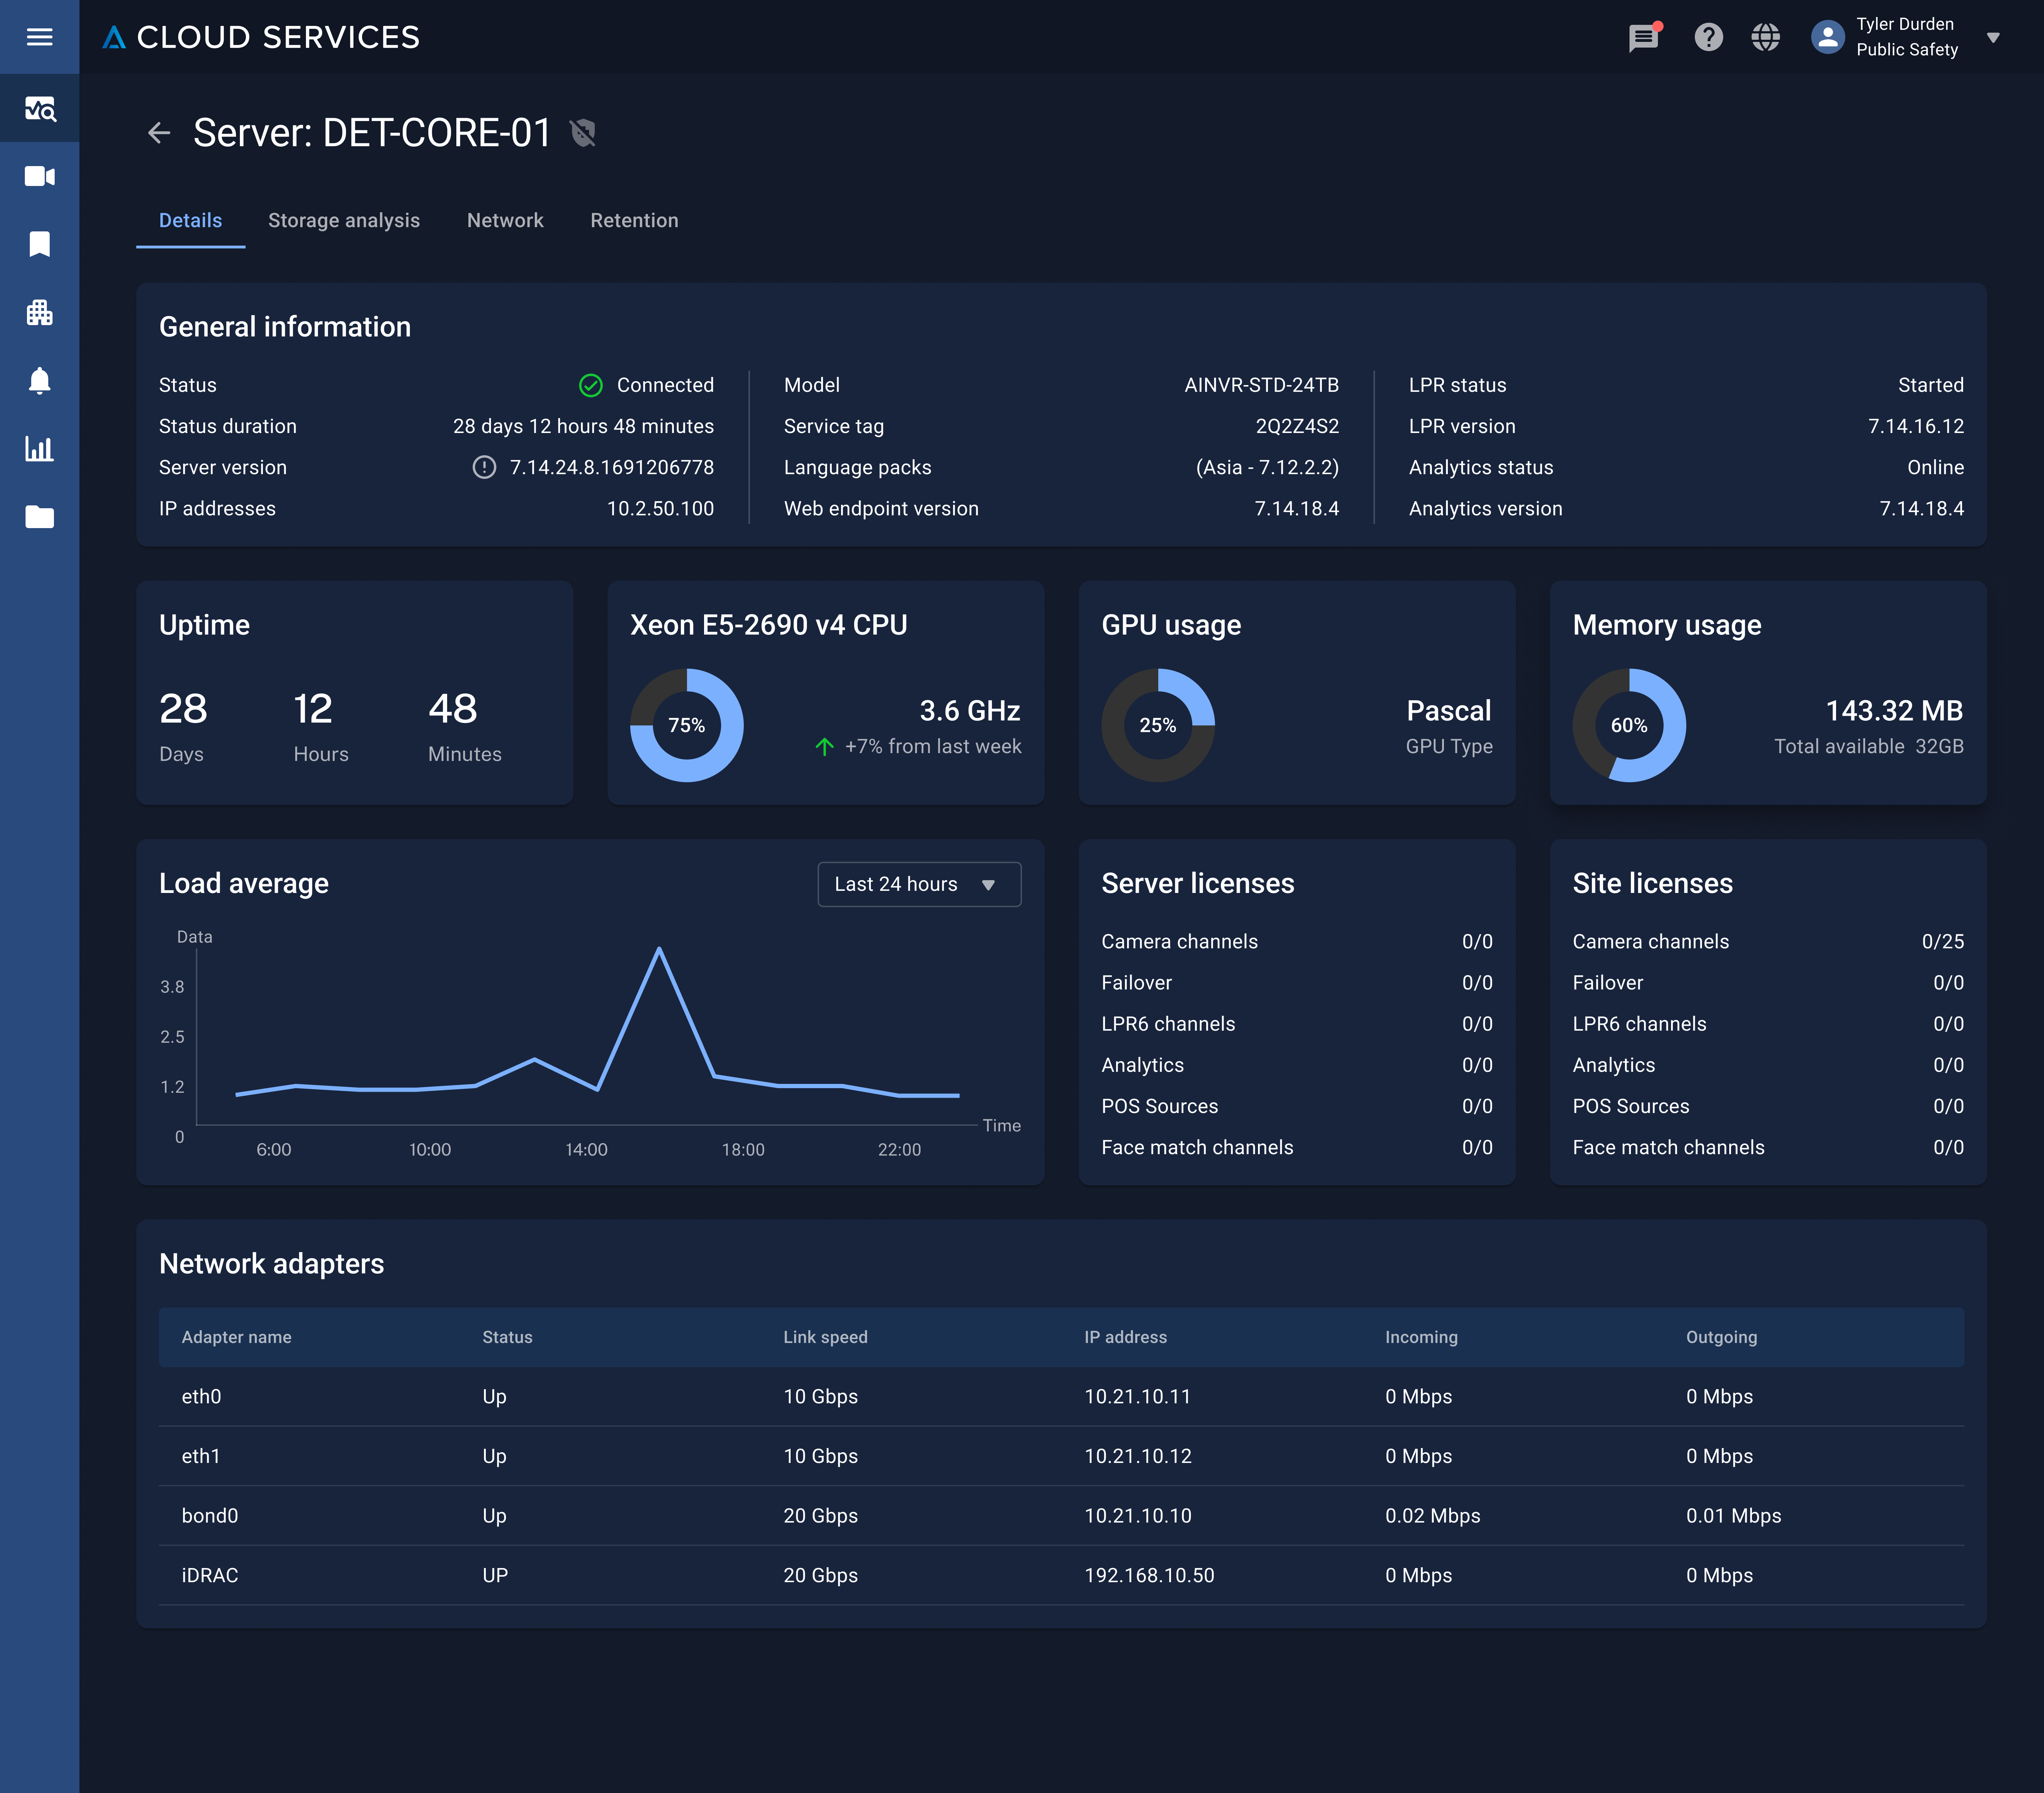
Server details

Camera details
A persistent "Action Now" dashboard element allows users to jump directly to resolving critical issues. Every status displayed is actionable, not just informational, reducing operator fatigue and enabling fast intervention.
Organized content hierarchically from high-level organizational health down to specific device status, supporting both enterprise overviews and detailed troubleshooting needs.
Built-in **role and access segmentation** ensures appropriate information visibility for different user types while maintaining **security and operational efficiency.**
The system was designed and tested to handle enterprise scale deployments with 10,000+ devices and thousands of status changes, using performance-optimized visualizations and efficient data handling.

Used data factory scripts to stress-test the dashboard with large organizational structures, simulating real-world enterprise deployments with thousands of devices and frequent status updates.
Implemented Microsoft Clarity for usage analytics and heatmapping in CI environment, with plans for production deployment to enable continuous iteration and improvement.
Built a systematic approach for ongoing iteration as the platform matured, including placeholder designs for future features like **privilege management, reporting, and licensing modules.**
Conducted validation sessions with major enterprise customers and partners, confirming that the dashboard addressed their most compelling reasons to adopt cloud-based solutions in traditionally on-premises environments.
**Trust is critical in enterprise dashboards** Users will not engage if statuses are perceived as inaccurate. Dashboards must prioritize actionable insights over information overload to be truly valuable. The importance of early investment in backend status accuracy cannot be overstated for **building user confidence and compliance.**
The roadmap includes richer analytics with sunburst charts, more sophisticated status and warning states, **enhanced privilege-aware dashboards**, and end-to-end integration with future cloud analytics modules. There's also opportunity for more **role-based dashboard customization**.
This project reinforced the importance of deep collaboration between design and engineering, especially when dealing with complex backend systems that affect user trust. In hindsight, I would have pushed for even earlier investment in status accuracy and more granular role-based customization to maximize user value and trust from day one.
The success of this dashboard became a key differentiator for Avigilon's cloud offerings, helping enterprise customers transition from traditional on-premises security systems to cloud-based solutions with confidence in **system monitoring and GRC control capabilities.**
